Running Your First Experiment
Viewing Experiment Runs in Real-Time
While you’re designing an experiment, nothing happens to your system. Everything is safe and you can’t harm it in any way. Ready to change that?
Once you click to run an experiment, you will be injecting the designed faults into your system to see the effect. Before you hit run, make sure that you’re doing it in an environment that is safe for chaos engineering. As we mentioned earlier, we also recommend that you start with narrow targeting and only expand your scope after you have built confidence in how your systems will respond.
Running Experiments
You can run experiments manually, with our internal scheduler, or with automation. For this lesson, we’ll focus on manually running an experiment using the Steadybit UI.
Once you are ready and comfortable with your experiment design, click “Run Experiment”.
You can then switch from the “Design” tab in the Editor to the “Run” tab to view your experiment run step-by-step.
At the top of the screen, you will see the same timeline-based view of steps with a progress bar showing how each step is being executed.
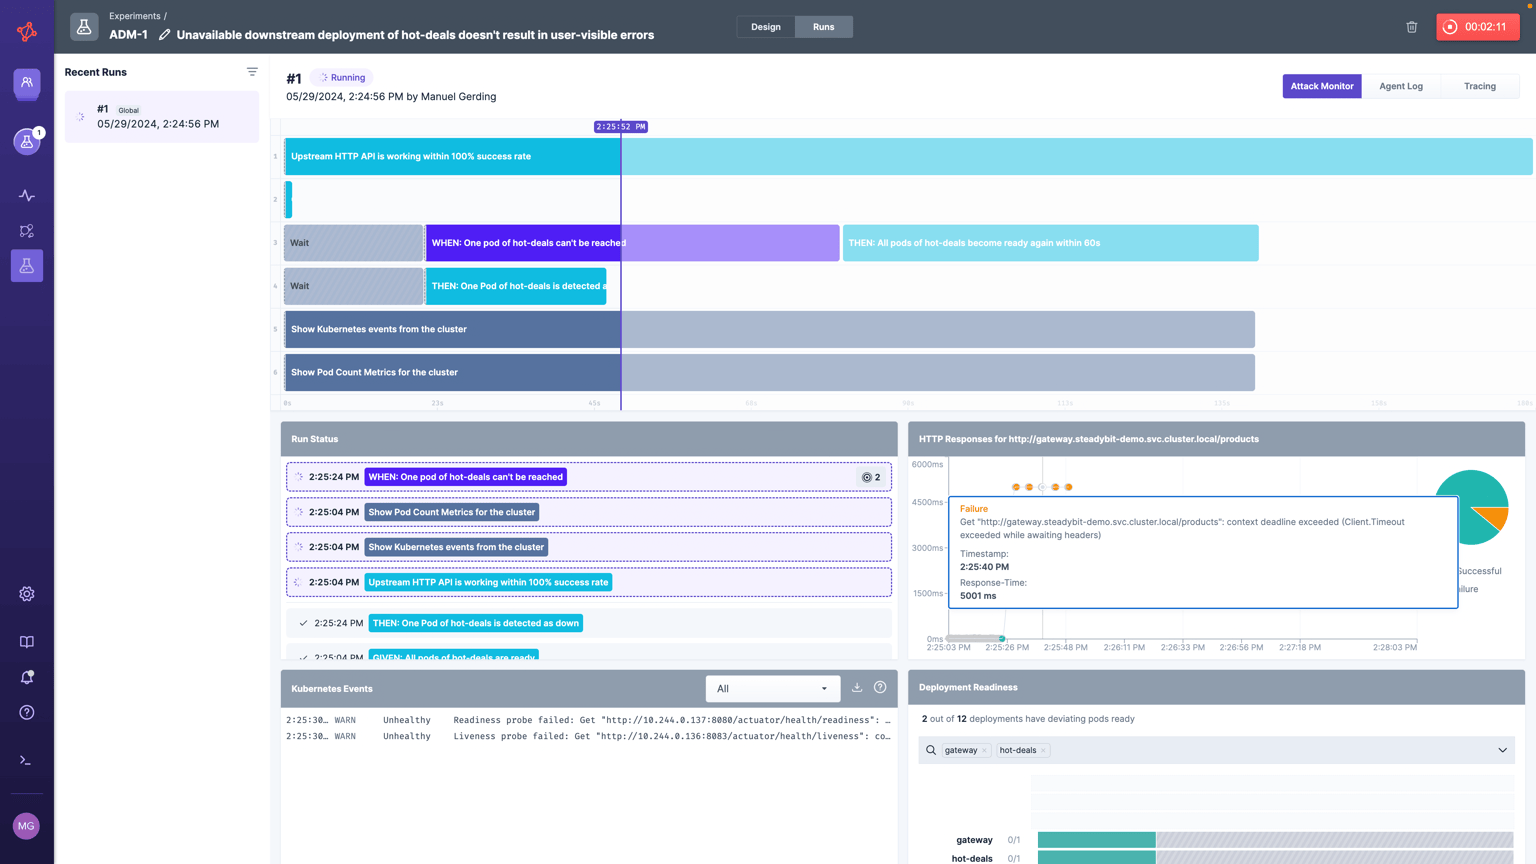
Below that, you will see a “Run Status” section that will show the status of each step.
Additional Checks & Monitoring Options
You will see additional sections depending on your installed extensions and experiment designs. For example, here are some common sections:
- “HTTP Responses for “X” Service”: If you want to monitor whether your fault injection has significantly degraded performance, you can run an “HTTP Check”action on your service throughout your experiment and see how the responses change in real-time.
- “Kubernetes Events”: If you add the “Kubernetes Event Logs” action to your experiment design, you’ll see a section with Kubernetes logs.
- “Deployment Readiness”: If you add the “Pod Count Metrics” action, you’ll be able to monitor whether you drop below a desired number of pods for any given deployment.
- Observability Integration: If you have installed an extension for your Observability tool of choice, you can add an action like “Monitor Status” to collect information about the state of your monitors and whether they detect issues as expected.
With additional checks, you’ll be able to clearly see in one place how your systems respond to this type of event.
Stopping Running Experiments
If you need to stop an experiment for any reason, you can just hit the red button timer in the “Run” view. You can also use the “Emergency Stop” action while viewing the “Current Activities” tab in the left-hand navigation to stop all running experiments and temporarily prevent new experiments from being executed.
If you stop a running experiment, you will see it labelled with the “Canceled” experiment status.
Experiment Results
When your experiment has finished running uninterrupted, you will see one of the following final states:
- Completed: The entire experiment and all actions were successfully executed with no failures or errors.
- Failed: The experiment run failed because the results did not prove the hypothesis, or failed one of your checks, such as the HTTP Check action meeting a specified success rate.
- Errored: The experiment failed to run due to a technical issue and will require some debugging to troubleshoot.
A completed experiment shows that your hypothesis was correct. A failed experiment shows that your expectation was not met and you need to revisit either your hypothesis or how your systems are configured.
Debugging with Agent Logs & Tracking
In the “Run” view, you will start on the “Attack Monitor” tab by default, but you can also toggle over to “Agent Logs” or “Tracing” for more information.
Agent Logs are helpful if you want to debug an experiment run. If you are troubleshooting with the Steadybit team, these logs will be especially helpful.
Tracing is documentation of the communication between the Steadybit platform and agents. We collect distributed tracing spans using OpenTelemetry. The primary use of this information is also debugging.
Lesson Summary
Now, you know how to run an experiment and watch it run in real-time. You can see if your system is responding as you expected and iterate to better understand your systems and improve their reliability. You also know what to look for when you run into an error and need to debug it. Next, we’ll explain how you can scale your approach with run scheduling and automation.