Testing Kubernetes Cluster Performance During High Latency from a 3rd-Party Service
Your critical application suddenly starts throwing errors. Users are submitting support tickets, alerts are firing, and your team is searching through logs to find the issue. It turns out that there is high latency from a third-party API, causing a key application function to timeout.
Scenarios like this result in customer frustration, breaches of Service Level Agreements (SLAs), and loss of business revenue as long as the outage persists.
In modern microservices architectures, dependencies on external services like payment gateways, data providers, and authentication systems are unavoidable. While they add functionality, they also introduce points of failure and performance variability.
The most effective way to understand how your application will behave under these stressful conditions is by running proactive experiments. By simulating failures and high latency, you can define performance limits and build robust, fault-tolerant systems.
In this post, we’ll explain why high latency from 3rd party services poses a real performance risk and how you can build and run chaos experiments to prepare your systems for this threat.
Why Testing for High Latency is Critical for SREs
If your application relies on a 3rd party service to function, an outage will have an obvious impact, but high latency can result in undetected errors over time.
For example, a slow response from a dependency can cause cascading failures and resource exhaustion. Imagine a service waiting for a slow API response; it holds onto threads and connections. As more requests come in, your application’s thread pool can become starved, making it unresponsive to all requests—not just those involving the slow dependency. Even without generating outright errors, persistent slowness will rapidly consume your error budget, directly affecting your ability to hit Service Level Objectives (SLOs).
Running proactive chaos experiments trains your teams to recognize, diagnose, and mitigate the impact of latency. With each experiment, you’ll build operational readiness and foster a culture around reliability.
Setting Up High Latency Chaos Experiments For Kubernetes
Ready to test your system’s dependencies? With the right approach and tools, running a targeted chaos experiment is straightforward.
To begin, you’ll need a Kubernetes cluster, a deployed application with a known third-party dependency, and a chaos engineering platform like Steadybit to orchestrate the experiment.
Step 1: Define an Experiment Hypothesis
Every good experiment starts with a clear hypothesis, or an expectation of what you expect to happen. This step ensures that you’re not just injecting faults randomly, but maintaining a scientific testing method.
For a high latency experiment, a strong hypothesis could look like this:
“If the external payment API (api.payment-gateway.com) experiences a 500ms latency increase for 5 minutes, our checkout service’s P99 response time will remain under our 1-second SLO, and the system will not experience resource exhaustion or crash.”
This statement is specific, measurable, and directly tied to your SLOs.
Step 2: Identify the Blast Radius
The “engineering” aspect of chaos engineering means being intentional and measured with experiments. It’s crucial to limit the experiment’s scope, or “blast radius,” to minimize potential impact on users, especially when starting out. You could do this by starting in non-production or test environments, or by impacting only a very small number of targets and expanding from there as you gain confidence in the expected result.
To start, target a single pod or a small subset of traffic to ensure the experiment is contained. A good chaos engineering tool will allow you to precisely select targets using Kubernetes labels, such as app=checkout and env=staging, ensuring that only the intended components are affected by the actions in the experiment.
Step 3: Simulate Latency with a Network Attack
Creating realistic latency is the core of the experiment. You will configure your chaos engineering tool to inject network latency into the egress traffic from your application pods to the specific third-party service’s endpoint. This mimics the real-world scenario of a slow API response.
With a platform like Steadybit, you can easily create a network latency experiment by selecting your target deployment, specifying the hostname of the external service (e.g., api.payment-gateway.com), and defining the amount of latency to inject (e.g., 500ms).
Once you have customized the experiment to fit your system or needs, your chaos engineering tool handles the complex work of manipulating the network at the container level, enabling you to focus your time on reviewing the results.
To see an example of this type of experiment, here is an experiment template from the Reliability Hub, an open-source chaos engineering library hosted by Steadybit.
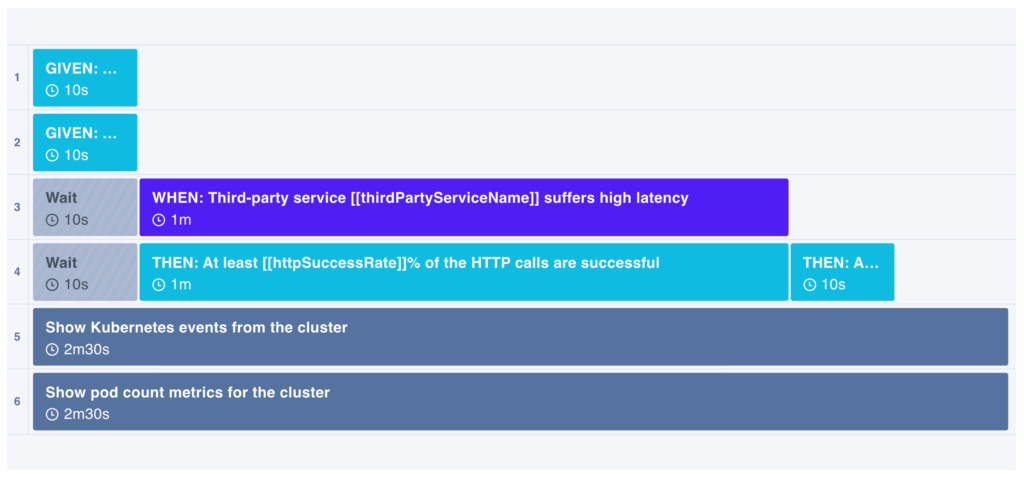
Steadybit Experiment Template: Third-Party Service Suffers High Latency for a Kubernetes Deployment
You can easily import and use these experiment templates to get started testing out common use cases fast.
Running the Experiment and Analyzing the Outcome
With your experiment defined, it’s time to run it and observe what happens. Careful monitoring is key to understanding your system’s behavior and validating your hypothesis. If you’re using an observability tool like Datadog, Dynatrace, or Grafana; you can seamlessly integrate with Steadybit to see anomalies and alerts occur while the experiment runs.
Monitoring Key Performance Indicators (KPIs)
During the experiment, keep a close watch on your dashboards for these critical metrics:
- P95/P99 Latency: The response time of your service. Does it breach your SLO?
- CPU and Memory Utilization: Watch for sudden spikes in the affected pods.
- Error Rates: Are failed requests or timeouts increasing?
- Connection Pool Usage: Is your application running out of available connections?
Reviewing Expected (and Unexpected) Outcomes
When you inject latency, you might see one of several outcomes:
- Graceful Degradation (The Ideal): Your application remains functional. It might respond slightly slower or automatically disable non-essential features that rely on the slow dependency, but the core user experience is preserved. This is a sign of a truly resilient system.
- Cascading Failures (The Worst-Case): The injected latency causes thread-pool exhaustion, leading to unresponsive services and a wider system outage. This indicates a critical weakness that needs immediate attention.
- Incorrect Timeout Configurations (The Common Find): You may discover that default or poorly configured timeouts cause requests to hang indefinitely, tying up valuable server resources. This is one of the most common and impactful discoveries from latency experiments.
Validating the Hypothesis
Once your experiment has finished running, compare the observed results against your initial hypothesis. Did your service’s latency stay within its SLO? Did the system remain stable?
If your hypothesis was incorrect, you have successfully revealed a reliability gap. Then, you can use these insights to improve your system’s resilience and rerun the experiment to validate your improvements.
Improving Kubernetes Resilience to High Latency
Finding a weakness is a win for reliability. Now, you can implement patterns to make your application stronger. Here are some of the most effective strategies:
Optimizing Timeout Settings
Never rely on default timeouts. Set aggressive but realistic timeouts for all external calls. It is far better for a request to fail fast than to hang and consume precious resources. A slow response is often worse than an error because it can tie up your entire system.
Implementing Circuit Breakers
The circuit breaker pattern prevents your application from repeatedly calling a service that is slow or failing. When calls to a dependency start to time out, the circuit breaker “trips” and immediately fails subsequent requests without even trying to contact the service. After a cooldown period, it allows a few requests through to see if the dependency has recovered. Libraries like Resilience4j or features built into service meshes like Istio make implementing this pattern easier. Here is a tutorial we wrote on setting up retries with Resilience4j.
Introducing Retries with Exponential Backoff
When a request fails, retrying is a useful strategy but how it’s configured matters. Retrying immediately can overwhelm a struggling dependency, making the problem worse. Implement retries with exponential backoff, which adds progressively longer delays between each retry attempt. This gives the struggling service more time to recover.
Running Proactive Kubernetes Experiments
If you want to ensure that your applications are resilient, you can either hope for the best or get proactive by running experiments on your Kubernetes clusters.
By embracing chaos engineering, you can move from a reactive firefighting mode to a proactive state of building operational excellence.
If you want to get started with chaos engineering, a tool like Steadybit can help lower the learning curve and make it easier to build experiments. You can try it yourself with a 30-day free trial or schedule a demo with our team to hear more.

Get started today
Full access to the Steadybit Chaos Engineering platform.
Available as SaaS and On-Premises!
or sign up with

Book a Demo
Let us guide you through a personalized demo to kick-start your Chaos Engineering efforts and build more reliable systems for your business!