How to Validate AWS ECS Auto Scaling Policies with Chaos Engineering

For services running on Amazon ECS, auto-scaling based on CPU demand is critical for maintaining performance during traffic spikes while avoiding over-provisioning during quiet periods.
But how can you be certain your auto-scaling rules will work as expected when you need them most? After you configure auto-scaling in the AWS console, you’ll need to validate that it actually is working in the way that you expect.
In this guide, we’ll walk through some basics on configuring auto-scaling so your ECS services will respond to variable CPU demands. Then, we’ll outline how you can validate that your system is working as you expect by running a chaos experiment with a tool like Steadybit.
Configuring Auto Scaling for AWS ECS Services
First, you’ll need to set up the necessary components in AWS to enable your ECS service to scale automatically. That includes creating CloudWatch alarms that monitor CPU usage and link them to scaling policies on your ECS service.
Understanding ECS Service Auto Scaling
ECS Service Auto Scaling dynamically adjusts the number of tasks running in your service based on demand. When metrics like CPU or memory utilization cross a certain threshold, it automatically increases or decreases the desired task count.
The key benefits are performance, by automatically adding capacity to meet rising demand and preventing outages, and cost optimization, but automatically scaling down resources when they are not needed.
Setting Up CloudWatch Alarms to Monitor CPU Utilization Levels
CloudWatch alarms are the triggers for your scaling actions. You’ll create an alarm that monitors the average CPU utilization of your ECS service and fires when it exceeds a predefined threshold.
To create an alarm:
- Navigate to the CloudWatch console in AWS.
- Go to Alarms and click Create alarm.
- Select Select metric. Find your service under ECS > ClusterName > ServiceName.
- Choose the CPUUtilization metric.
- Set the Statistic to Average and define a period (e.g., 1 minute).
- Under Conditions, set the threshold. For example, you could trigger the alarm when CPU utilization is Greater > 75 percent for 1 consecutive period.
By creating two alarms, you can use one as the threshold for scaling up (e.g., CPU > 75%) and the other for scaling down (e.g., CPU < 25%).
Configuring ECS Service Auto Scaling Policies
Once you have your alarms ready, you can now configure the scaling policies.
Here’s a step-by-step guide:
- Open the Amazon ECS console and navigate to your cluster.
- Select the service you want to configure.
- Go to the Service scheduling tab and find the Service auto scaling section. Click Edit.
- Define your task counts:
- Minimum number of tasks: The lowest number of tasks the service should run.
- Desired number of tasks: The default number of tasks when the service starts.
- Maximum number of tasks: The highest number of tasks the service can scale up to.
- Click Add scaling policy.
- Create a scale-out policy (to add tasks):
- Policy type: Step scaling or Target tracking. Target tracking is often simpler, aiming to keep a metric at a specific value.
- Policy name: Give it a descriptive name like cpu-scale-out.
- CloudWatch alarm: Select the scale-up alarm you created earlier.
- Scaling action: Define how many tasks to add (e.g., add 2 tasks).
- Cooldown period: Set a time (e.g., 300 seconds) to wait before another scaling action can occur, preventing flapping.
- Repeat the process to create a scale-in policy linked to your scale-down alarm.
Once saved, your ECS service is now configured to scale automatically based on CPU load.
Validate Auto Scaling Policies with Chaos Engineering
How can you tell if your policies are set up correctly? Beyond a binary of working or not, how can you ensure they are optimized to your desired performance?
You won’t be able to really know until you test them.
This is where chaos engineering with Steadybit comes in. By running an experiment to simulate a CPU spike, you can validate that your auto-scaling policies trigger correctly and that your system responds within your required SLOs. With a proactive experiment, you can answer questions like:
- Does our scaling policy trigger at the right threshold?
- How long does it take for new tasks to become healthy and serve traffic?
- Does our system remain stable during the scaling event?
If you wait for these events to occur naturally in Production, you are subjecting your end users to untested application performance and locked into a reactive reliability approach.
Connecting a Chaos Engineering Platform to Your ECS Services
To run chaos experiments easily, you can use a platform like Steadybit. Just install one agent per network and open source extensions for each technology you want to target. With the AWS extension installed, Steadybit will automatically discover infrastructure components like ECS services and tasks. If you are using an Observability tool like Datadog, Grafana, or Dynatrace, you can easily connect with Steadybit for more performance visibility.
Designing Your ECS Auto Scaling Test
Once connected, you can select our pre-built experiment template for validating ECS scaling and customize the following aspects:
- Target the Service: In the experiment wizard, select the ECS service you configured for auto-scaling and the exact resources you want to include in the experiment.
- Define the Attack: The core of this experiment is a CPU attack. Configure it to simulate a realistic load.
- CPU Load: Set a percentage of CPU to consume (e.g., 80%) to ensure it crosses your CloudWatch alarm threshold.
- Duration: Define how long the attack should run (e.g., 10 minutes) to give the scaling action enough time to complete.
- Set a Hypothesis: This is where you define your success criteria. Create a “Task Count” check to verify the outcome.
- Condition: Task count reaches at least a specific number (e.g., your desired count + tasks added by the scale-out policy).
- Time Constraint: Configure the check to ensure this state is reached within a certain time (e.g., 5 minutes).
With the experiment configured, you are ready to run it. Executing the experiment in Steadybit is as simple as clicking a button.
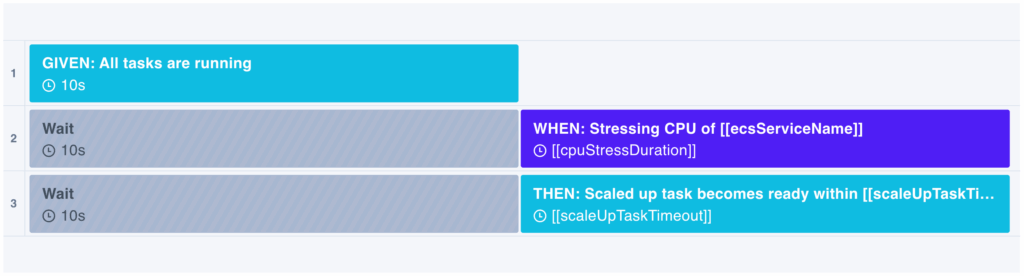
Steadybit Experiment Template: AWS ECS Service Scaled Up Within Reasonable Time
You’ll see a real-time view of the experiment’s progress, and you can monitor the CPU attack as it begins and abort the action at any time.
Analyzing the ECS Service Experiment Results
Once the experiment is complete, the results view will clearly show whether your scaling validation was successful.
- Success: If the task count increased to the expected level within the defined time, the experiment will be marked as successful. You now have evidence that your auto-scaling configuration works.
- Failure: If the service failed to scale up, the experiment will fail. The results will help you troubleshoot. Was the CloudWatch alarm threshold too high? Was the cooldown period too long? Did the new tasks fail to become healthy?
This data-driven approach removes guesswork and allows you to methodically harden your system’s resilience.
And remember, infrastructure and application code change. What worked last month might not work today. We recommend adopting the practice of continuous verification, where you automate and integrate reliability tests like this into your CI/CD pipeline. This helps you catch issues early and maintain a strong reliability posture over time.
Getting Started with Continuous Verification
Are you interested in hearing more about how you can use proactive experiments to optimize your system performance? With Steadybit, we help teams build confidence in their systems by making it easy to run experiments and get meaningful performance insights.
Ready to put your systems to the test? You can start a 30-day free trial today or schedule a quick demo with our experts. We’d be happy to share why teams across industries are choosing Steadybit as their go-to platform for reliability.

Get started today
Full access to the Steadybit Chaos Engineering platform.
Available as SaaS and On-Premises!
or sign up with

Book a Demo
Let us guide you through a personalized demo to kick-start your Chaos Engineering efforts and build more reliable systems for your business!