How to Prepare Your Services to Handle Availability Zone Outages
Availability zone outages are rare but incredibly disruptive. On October 20th, a DNS issue in Amazon’s US-EAST-1 region resulted in outages across all of its 5 zones. Critical applications stopped working and customers were left stranded across industries. Once again, engineering teams saw just how vulnerable their services could be to dependencies.
Following the outage, some people took the opportunity to advocate for a multi-cloud or multi-region strategy. Others seemed to throw their hands up and accept that outages like this are just an inevitable result of any modern cloud architecture.
Regardless of your configuration, Availability zone (AZ) outages will occur. Some degradation may be unavoidable. By testing for chaotic conditions proactively, you can ensure that your services still deliver an optimal customer experience.
Reliability can be a true competitive advantage in keeping customers happy and winning new ones.
In this article, we’ll explain how you can use chaos engineering principles to run availability zone outage experiments on your systems. Don’t guess how your systems will respond. Test it.
Distributing Systems Across Availability Zones
If you run all of your services from within one availability zone, an availability zone outage will disable your entire system. That’s why it’s a reliability best practice to have coverage across multiple availability zones, so when one AZ goes down, traffic can be rerouted.
During rerouting, the load on the remaining Availability Zones (AZs) will increase. If only one AZ remains, it must absorb the full scale-up on its own. If multiple AZs remain, they can distribute the increased demand, allowing for a smoother transition. However, this works effectively only if each AZ has been provisioned with enough headroom to absorb the full projected load in the event of an AZ loss.
Paying for resources in multiple availability zones can be expensive, but outages impacting customers can be equally or much more expensive. You can read more about the benefits of using at least 3 availability zones in this AWS post here.
By testing how your systems perform their failover processes, you can better understand where to invest to efficiently maximize your performance and reliability.
Simulating Availability Zone (AZ) Outages with Chaos Engineering
Proactive reliability tests, or chaos experiments, intentionally inject failures in your systems in a controlled, safe way. To simulate an availability zone outage, you can run what’s called a blackhole attack.
What is a Blackhole Attack?
A blackhole attack simulates a complete network outage within a specific availability zone (AZ) or subnet. It effectively drops all incoming and outgoing network traffic for the targeted area, creating a “blackhole” where services become unreachable.
Real-world events that can mimic a blackhole zone attack include:
- A misconfigured network access control list (ACL) that accidentally blocks all traffic.
- A physical network hardware failure within a data center.
- A widespread cloud provider outage affecting an entire availability zone.
By simulating this attack, you can see exactly how your system behaves when a significant part of its infrastructure suddenly goes dark.
More specifically, you can check if your traffic failover process works correctly, how the remaining services handle the increased load, and whether your monitoring tools detect the issue and raise an alert in a timely manner.
Setting Up Tooling to Run Chaos Experiments
For this walkthrough, we will use Steadybit, a leading chaos engineering platform with a drag-and-drop editor for designing and running experiments quickly.
Before you begin, ensure you have the following prerequisites in place:
- Access to Steadybit: You will need an active Steadybit account, installed via SaaS or On-prem. You can try Steadybit for free for 30 days by creating a trial account.
- Installing Agents & Cloud Extensions: If you want to test your environments directly, you will need to first install the Steadybit agents, one per network boundary. Next, you should install the extension for the cloud provider you use: AWS, GCP, or Azure.
- Install Monitoring Extensions: You can check for alerts and gather more thorough logs by installing the extension for your particular Observability tool: Dynatrace, Datadog, Grafana, Prometheus, and more.
You can use open source scripts to run experiments like this, but that approach makes it more challenging to deploy experiments and review results.
Designing Blackhole Zone Attack
Once you have Steadybit set up, you’re ready to build your first blackhole experiment. Here are the next steps to take:
Step 1: Choose Targets for Your Experiment
By installing the Steadybit agent and related extensions, Steadybit is able to automatically discover your cloud resources like AWS EC2 instances and subnets. You can review your targets and identify the AZ or subnet(s) you want to isolate.
We generally recommend starting your experiments with non-production environments (e.g. “Dev” or “QA”) to avoid negatively impacting real users.
Step 2: Design the Experiment
In the Steadybit UI, navigate to the Experiment Editor to design your experiment. You can either use a pre-built template or build from scratch. If you want to start with a blank canvas, here’s what you would do:
- Define the Attack: Add a new network attack by selecting the “Blackhole Zone” action and dragging it into the canvas.
- Select the Target: Choose which AWS Availability Zones you want to target with this attack. Steadybit will show you all discovered targets with related metadata like region or AZ, which helps make selecting targets easy.
- Set the Duration: The experiment will block traffic by creating and assigning a new network ACL to every subnet in every VPC in the selected zone. For your first run, a short duration like 60 seconds is often sufficient to observe the initial impact without causing prolonged disruption.
- Add Checks: You can add checks to run over the course of your experiment, like a periodic HTTP request on a certain endpoint. You could also add a check to see whether your monitoring tool raises relevant alerts as expected.
You can see an example of this type of experiment here. The experiment is designed to check that the HTTP request is successful initially before start the blackhole zone attack. There is a wait step to account for recovery time. Then, the HTTP check resumes to ensure that the service has recovered in the amount of time expected:
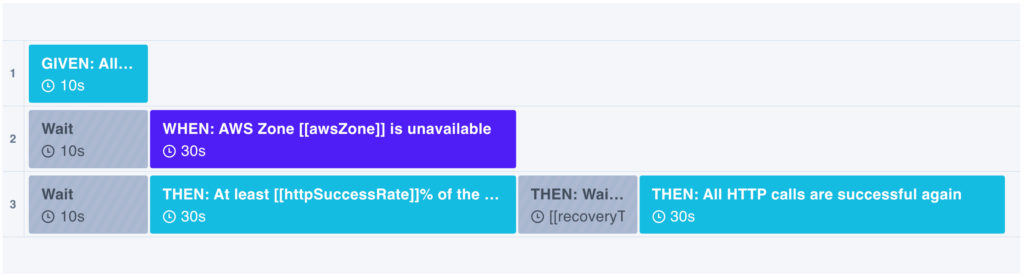
Experiment Template: Load Balancer Covers an AWS Zone Outage
If you want to run an experiment that only simulates a subnet outage, you would take the same steps, except you would select the “Blackhole Subnet” action instead and specify an AZ to take out during the experiment.
Step 3: Execute the Experiment
When you are happy with your experiment design, you can hit “Run Experiment” to watch it run in real-time.
As the experiment executes, Steadybit will apply the blackhole by modifying the network ACLs to deny all inbound and outbound traffic for the selected zone(s). Throughout the experiment, any checks that you set up will allow you to actively monitor your system’s key performance indicators (KPIs). Referencing your observability dashboard can also be helpful for things like error rates, latency, and resource utilization in the remaining active zones.
Step 4: Review the Performance Results
Once the experiment is finished, Steadybit will automatically revert all changes, restoring network traffic to the targeted subnet. Now, you can analyze exactly how your systems handled the outage.
- Did your application traffic successfully failover to the healthy availability zones?
- Did your monitoring systems trigger the expected alerts?
- Did any services experience degraded performance or crash entirely?
- Were there any unexpected cascading failures?
For example, if you found that traffic did not failover, you might need to adjust your load balancer or Kubernetes service configurations. If alerts didn’t fire, you may need to make updates in your observability tool.
Whatever the results are, you now have real data you can review to see if you can make any improvements.
Step 5: Continuous Verification
After implementing any fixes, you should run the experiment again to verify that your changes have resolved the problems that you intended to solve.
Since systems are constantly changing, this iterative cycle of testing, learning, and improving is critical to building truly resilient systems. To accomplish this, some teams build experiments into their CI/CD workflows as a quality gate to maintain reliability standards over time.
By identifying and validating the limits of your systems, you can map out key break points and know how your services will react to different conditions.
Adopting Proactive Reliability Practices
By proactively testing for failures, you can ensure your services remain highly available and delivering for your customers. Failures are inevitable, but being prepared for failures is a choice that your organization actively makes.
Are you ready to test the resilience of your systems?
Get started with a free trial of Steadybit today to explore how chaos experiments can upgrade the reliability of services across your organization.

Get started today
Full access to the Steadybit Chaos Engineering platform.
Available as SaaS and On-Premises!
or sign up with

Book a Demo
Let us guide you through a personalized demo to kick-start your Chaos Engineering efforts and build more reliable systems for your business!