Help your teams to understand hidden risks
before they turn into incidents
Understand System’s Complexity
Be prepared
The complexity of your system is not a problem anymore
Restore confidence
Easily ensure your architecture is resilient and scalable
No hidden risks
Identify possible risks before they become incidents – it’s never been so easy

Cut Through the Complexity of your System
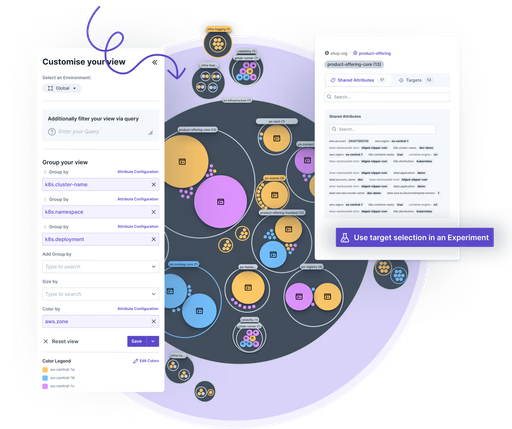
Steadybit continuously discovers static and dynamic data about your system’s components.
With the Steadybit Explorer, you have all of that data at your fingertips. Choose from various visualization options to pinpoint potential reliability issues and easily create Chaos experiments based on your insights.

Built-in visibility for Kubernetes and State Checks
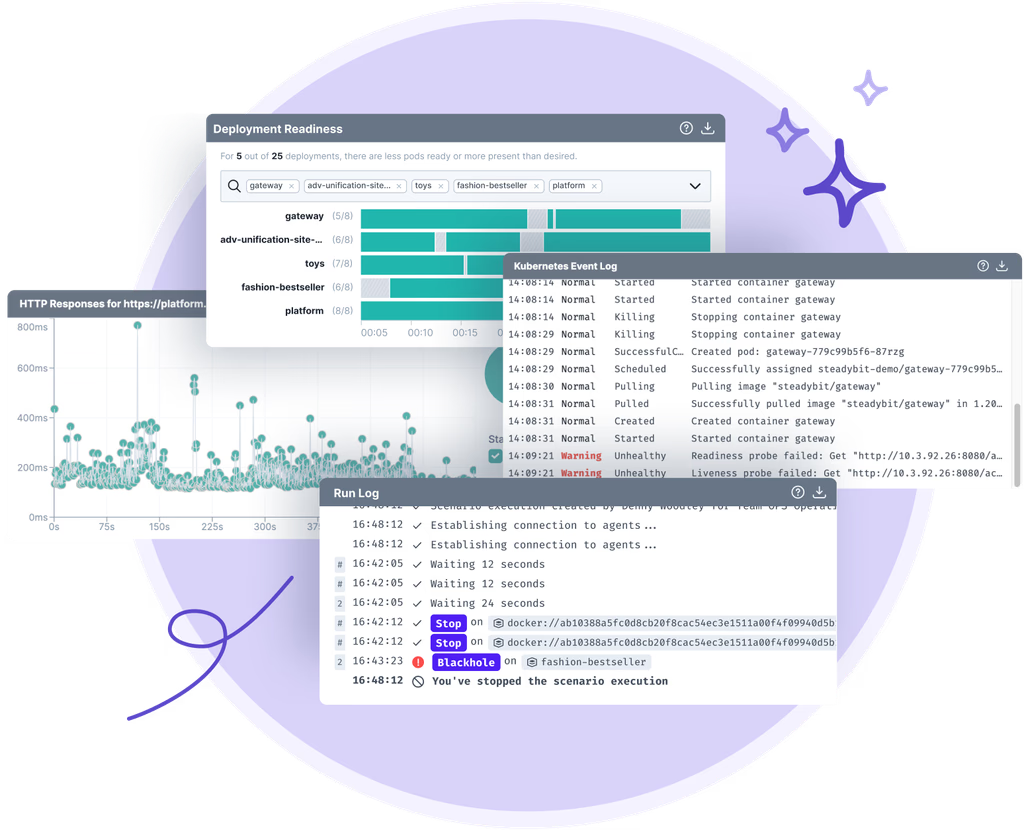
In the centralized execution view, you will get complete information out-of-the-box for your state checks and Kubernetes clusters. This allows you to see all the impacts on your system.
With all the information in one place, it’s easier to correlate the actions with their impact.

Pull in the critical data from monitoring and trigger your existing load tests
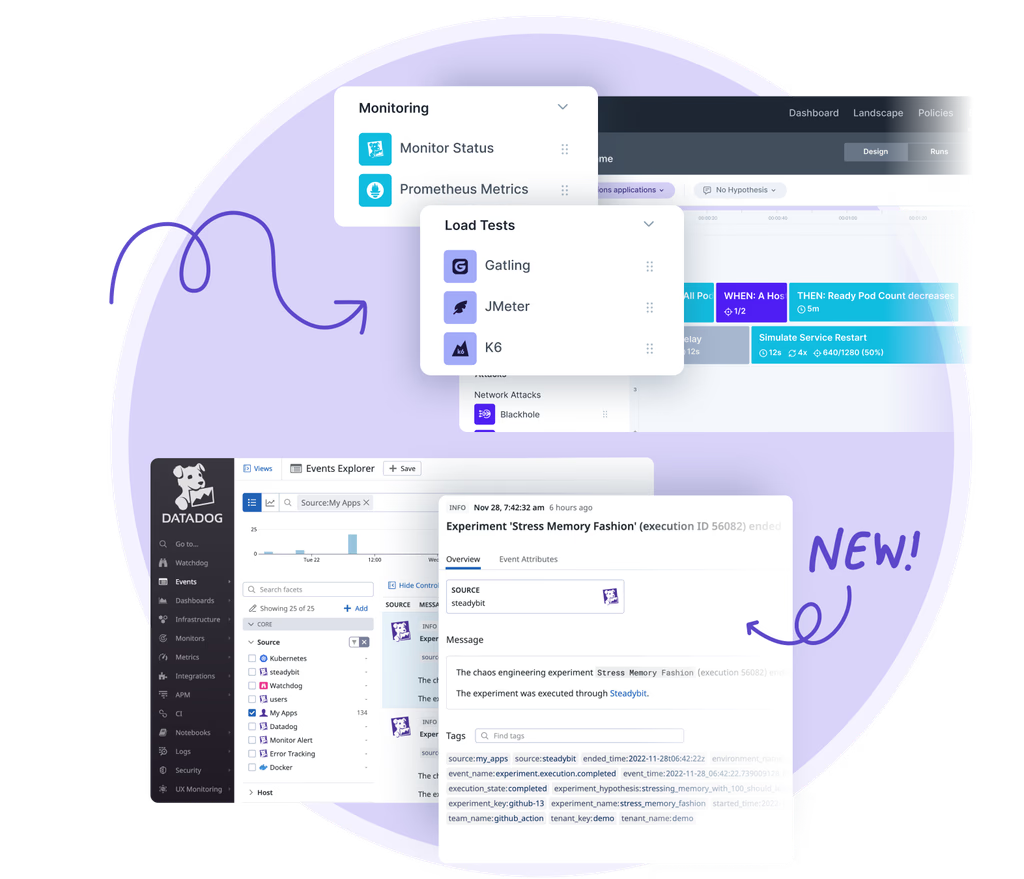
Use valuable data from your monitoring tools for state checks and visualize it in the execution view. By using the same checks you’re already using for alerting, you can validate their configuration and see the results from a more thorough perspective.
It’s also easy to integrate your load tests into chaos experiments with Steadybit. You can run existing load tests directly from Steadybit or trigger experiments from your other testing tools.
Need to integrate a tool that doesn’t have a pre-built extension? Steadybit is fully extensible. Creating custom extensions is easy.

Continuously verify your reliability posture
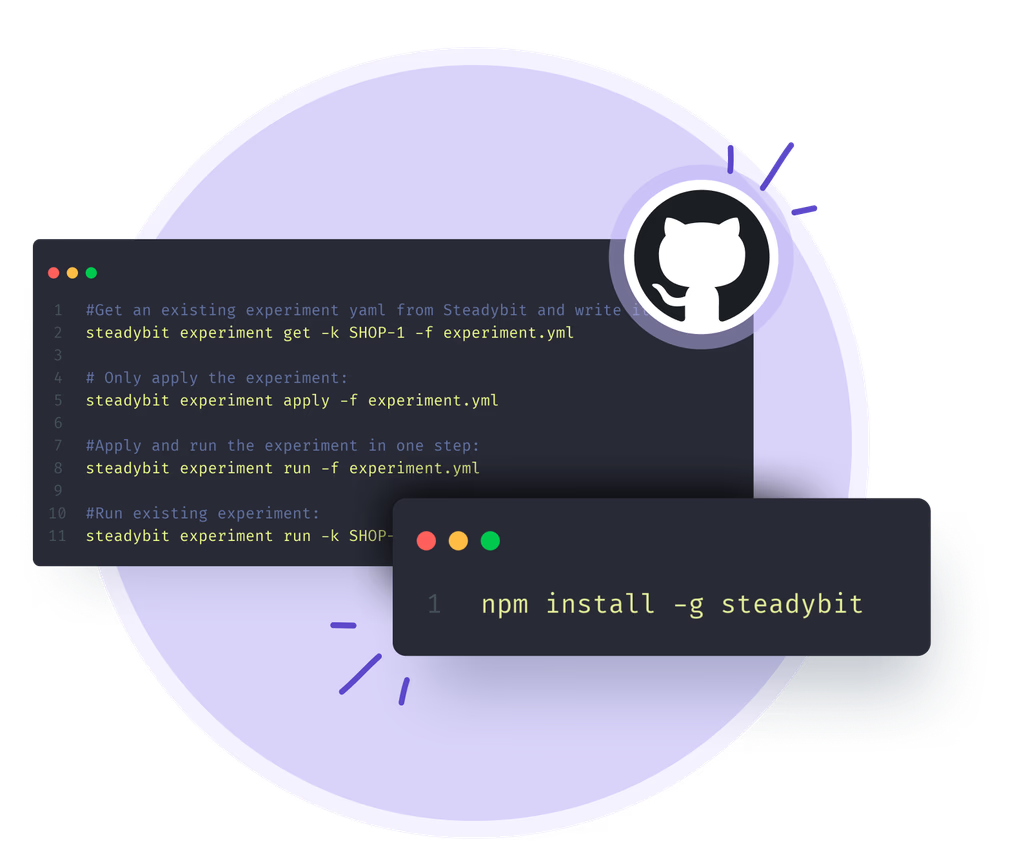
As you push new changes to your systems, it’s important to check their impacts on reliability before they reach production. Integrate Steadybit experiments seamlessly into your CI/CD pipeline using our CLI, HTTP API, or GitHub Actions. Build confidence with each release.

Get started today
Full access to the Steadybit Chaos Engineering platform.
Available as SaaS and On-Premises!

Book a Demo
Get a personalized demo to see how chaos engineering with Steadybit can help you build a culture of reliability.