
Open Source Integrations
Run experiments across your full tech stack to boost reliability
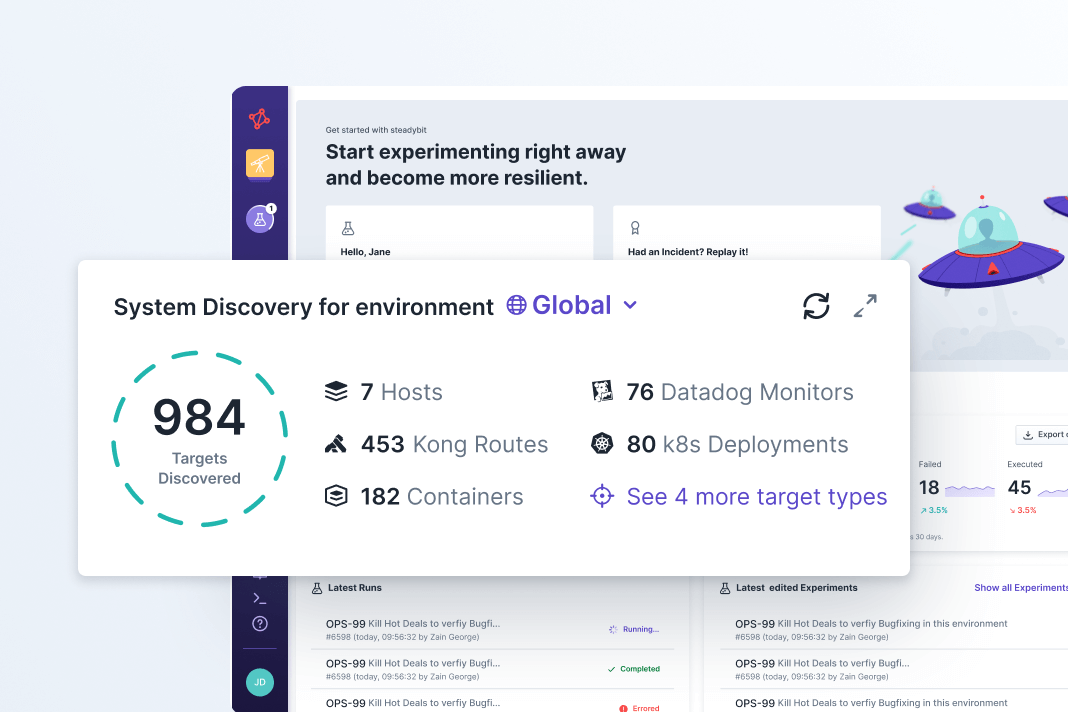
Steadybit makes it easy to discover targets across your tech stack and run experiments safely. With open source extensions for popular technologies, it’s easy to discover a wide range of targets and run actions to stress test your system.
- Support for any configuration: Cloud, Multi-cloud, On-Prem, Air-gapped, Kubernetes, VMs, Serverless, Service Mesh, Message Brokers, etc.
- Inject faults and run health checks at the network, resource, and application layers
- Visualize your systems and group targets with discovered metadata
Install the Steadybit Agent
You only need to install one agent per network boundary
Install popular extensions
Choose from any of the 20+ open source extensions for popular tools
Add your own custom extensions
Use our Kits to integrate with external tools and home-brewed services
Run experiments across your full tech stack
With our open source extensions, you can quickly connect to popular tools.
All Integrations
Hosts & VMs
Kubernetes
Cloud Services
Observability
API & Load Testing
Streaming
Apache Kafka
Open source, distributed event streaming platformApache JMeter
Open source load testing tool for web applicationsAppDynamics
Application performance monitoring platform by SplunkAWS Elastic Compute Cloud (EC2)
AWS cloud computing serviceAWS Elastic Container Service (ECS) on EC2 or Fargate
Container orchestration serviceAWS Elastic Kubernetes Service (EKS)
Kubernetes service by AWSAWS Elastic Load Balancers (ELB)
Dynamic load balancer serviceAWS Elasticache
Fully-managed in-memory caching service by AWSAWS Fault Injection Service (FIS)
Chaos engineering tool for AWSAWS Lambda
Serverless, event-driven compute service by AmazonAWS Managed Streaming for Kafka (MSK)
Managed Kafka service by AWSAWS Relational Database Service (RDS)
Dynamic AWS database serviceAzure Container Apps
Managed serverless containers for microservicesAzure Event Hub
Real-time data streaming platform on Microsoft AzureAzure Functions
Serverless compute service on AzureAzure Kubernetes Service (AKS)
Kubernetes service by MicrosoftAzure Virtual Machines (VMs)
Dynamic cloud computing service by Microsoftcontainerd
Open source tool for managing container runtimeCRI-O
Lightweight container engine for KubernetesDatadog
Enterprise application monitoring platformDebian
Linux-based distribution and operating systemDocker
Popular open source container service providerDynatrace
Observability and application monitoring platformFedora
Open source Linux distribution sponsored by Red HatGatling & Gatling Enterprise
Open source and commercial tooling for load testingGitHub
Developer platform for distributed version controlGCP Virtual Machines (VMs)
Dynamic cloud computing service by GoogleGoogle Kubernetes Engine (GKE) & GKE Autopilot
Kubernetes service by GoogleGrafana
Open source observability and analytics platformHA Proxy
Open source load balancer and proxy for applicationsInstana by IBM
Application monitoring platform by IBMIstio
Open source service mesh platform for microservices
Java Virtual Machines (JVM)
Virtual environments for running Java bytecodeJenkins
Open source CI/CD automation server for software deliveryK6 & K6 Cloud
Open source load testing tools by Grafana LabsKong
Open source API gateway and service mesh platformKubernetes
Popular open source container orchestration platformLinux
Open source operating system built around the Linux kernelminikube
Open source tool that runs a single-node Kubernetes clustersNew Relic
Full-stack application monitoring platformNGINX
Popular open source Ingress controller for KubernetesOpenText LoadRunner
Proprietary tool for load & performance testingPostman
Collaborative API testing and development platformPrometheus
Open source metrics and monitoring systemRabbitMQ
Open source messaging and streaming brokerRed Hat OpenShift
Enterprise Kubernetes platform for containerized applicationsSlack
Team communication and messaging platformSplunk
Observability and security monitoring platformSpring Applications
Java-based applications built on the Spring FrameworkStackState by SUSE
Application monitoring platform by SUSEUbuntu
Enterprise-focused OS built around the Linux kernelWindows
Proprietary operating system developed by MicrosoftAWS Elastic Compute Cloud (EC2)
Container orchestration serviceAzure Virtual Machines (VMs)
Dynamic cloud computing service by MicrosoftDebian
Linux-based distribution and operating systemFedora
Open source Linux distribution sponsored by Red HatGCP Virtual Machines (VMs)
Dynamic cloud computing service by Google
Java Virtual Machines (JVM)
Virtual environments for running Java bytecodeLinux
Open source operating system built around the Linux kernelUbuntu
Enterprise-focused OS built around the Linux kernelWindows
Proprietary operating system developed by MicrosoftAWS Elastic Container Service (ECS) on EC2 or Fargate
Container orchestration serviceAWS Elastic Kubernetes Service (EKS)
Kubernetes service by AWSAzure Kubernetes Service (AKS)
Kubernetes service by Microsoftcontainerd
Open source tool for managing container runtimeCRI-O
Lightweight container engine for KubernetesDocker
Popular open source container service providerGoogle Kubernetes Engine (GKE) & GKE Autopilot
Kubernetes service by GoogleHA Proxy
Open source load balancer and proxy for applicationsKubernetes
Popular open source container orchestration platformminikube
Open source tool that runs a single-node Kubernetes clustersNGINX
Popular open source Ingress controller for KubernetesRed Hat OpenShift
Enterprise Kubernetes platform for containerized applicationsAWS Elastic Compute Cloud (EC2)
AWS cloud computing serviceAWS Elastic Container Service (ECS) on EC2 or Fargate
Container orchestration serviceAWS Elastic Kubernetes Service (EKS)
Kubernetes service by AWSAWS Elastic Load Balancers (ELB)
Dynamic load balancer serviceAWS Elasticache
Fully-managed in-memory caching service by AWSAWS Fault Injection Service (FIS)
Chaos engineering tool for AWSAWS Lambda
Serverless, event-driven compute service by AmazonAWS Managed Streaming for Kafka (MSK)
Managed Kafka service by AWSAWS Relational Database Service (RDS)
Dynamic AWS database serviceAzure Container Apps
Managed serverless containers for microservicesAzure Event Hub
Real-time data streaming platform on Microsoft AzureAzure Functions
Serverless compute service on AzureAzure Kubernetes Service (AKS)
Kubernetes service by MicrosoftAzure Virtual Machines (VMs)
Dynamic cloud computing service by MicrosoftGCP Virtual Machines (VMs)
Dynamic cloud computing service by GoogleGoogle Kubernetes Engine (GKE) & GKE Autopilot
Kubernetes service by GoogleAppDynamics
Application performance monitoring platform by SplunkDatadog
Enterprise application monitoring platformDynatrace
Observability and application monitoring platformGrafana
Open source observability and analytics platformInstana by IBM
Application monitoring platform by IBMNew Relic
Full-stack application monitoring platformPrometheus
Open source metrics and monitoring systemStackState by SUSE
Application monitoring platform by SUSESplunk
Observability and security monitoring platformApache JMeter
Open source load testing tool for web applicationsGatling & Gatling Enterprise
Open source and commercial tooling for load testingK6 & K6 Cloud
Open source load testing tools by Grafana LabsKong
Open source API gateway and service mesh platformOpenText LoadRunner
Proprietary tool for load & performance testingPostman
Collaborative API testing and development platform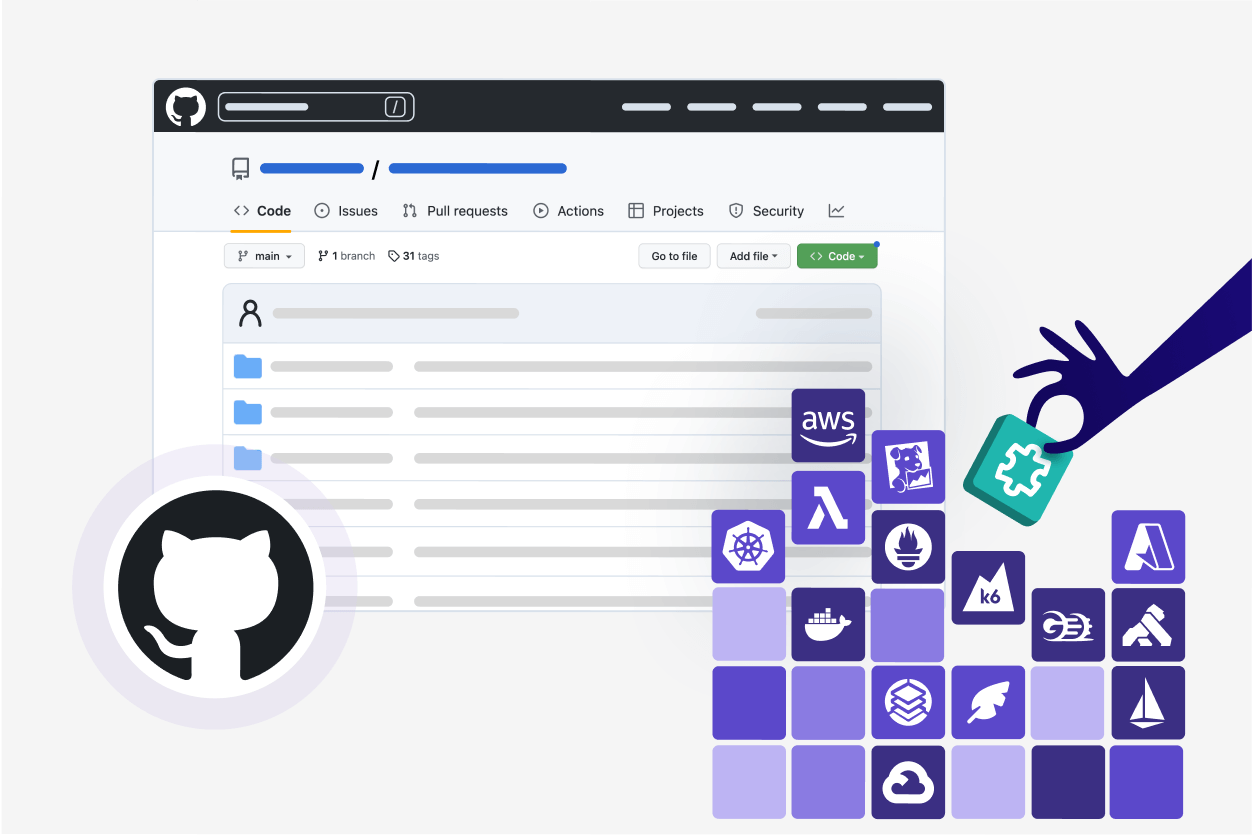
Missing a key integration? Create your own extensions easily.
- Use our ExtensionKits to create new extensions with your preferred language
- Add custom fault injections or actions by using the ActionKit
- Customize Reliability Advice with the AdviceKit to check for specific issues
Chaos Engineering Library
Explore the Reliability Hub
Our library of 200+ open source actions and templates makes it easy for you to design and run new reliability tests quickly.