Track Your Chaos Engineering Progress with Reporting in Steadybit
Rolling out chaos engineering across an organization takes more than good intentions. It takes data. Proof that something happened. Insight into what worked. Clarity on what to do next.
That’s what Reporting gives you. A way to track, share, and dive into the work your teams are doing inside Steadybit.
What you can do with Reporting and and why it matters
See how many experiments are being run, by whom, and when
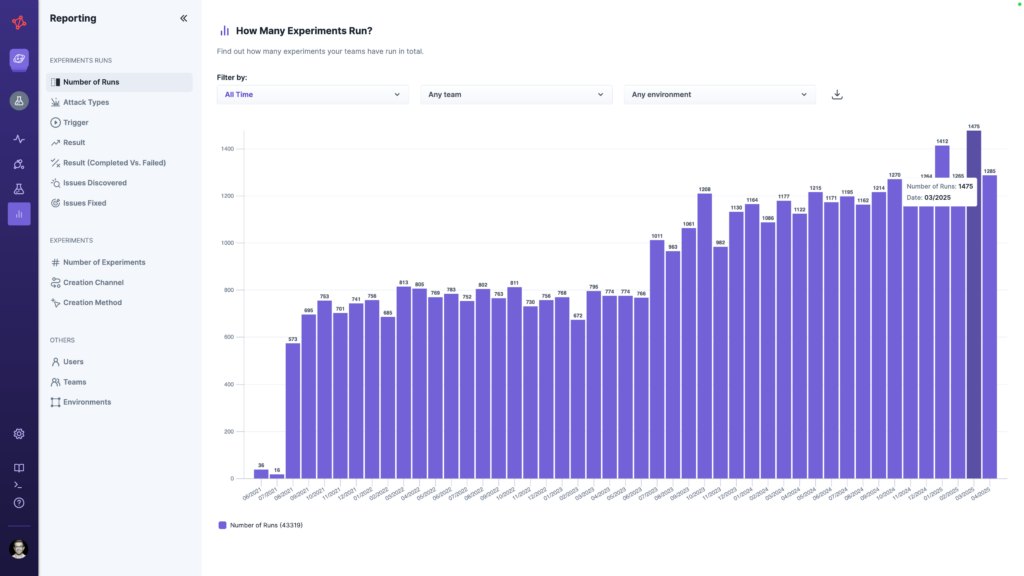
This tells you where momentum is building and where support might be needed. If some teams are consistently running experiments while others are silent, that’s a cue to check in. If activity spikes after training or a rollout, that’s a measurable impact. Instead of assuming engagement, now you know who’s participating and when.
Track which fault types have been tested
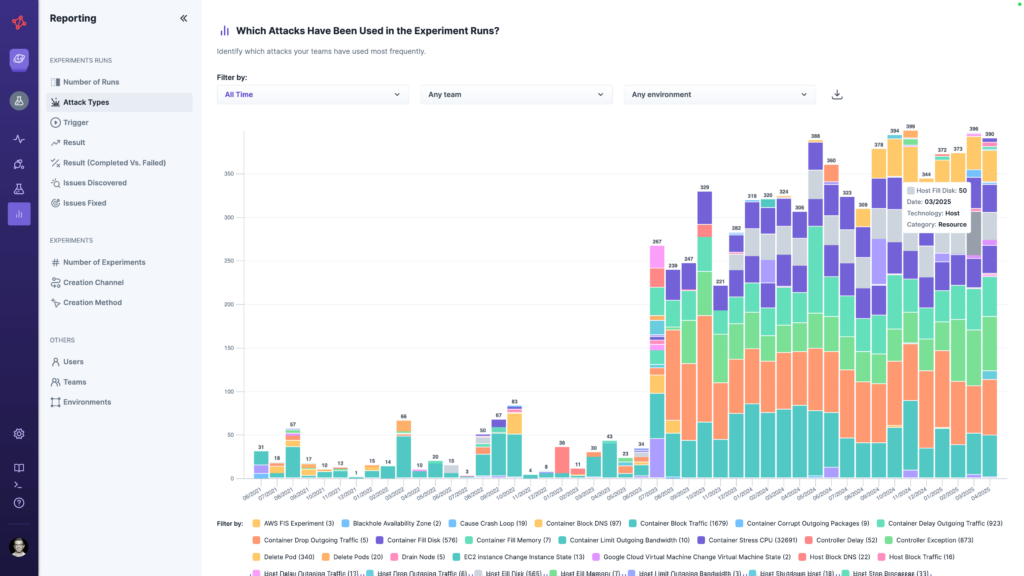
You’ll get a clear view of what’s been covered and what hasn’t. Maybe HTTP latency has been stress-tested extensively, but nobody’s touched disk I/O faults. This insight lets you adjust your plans, avoid blind spots, and make more intentional decisions about where to focus next.
Monitor how experiments perform over time
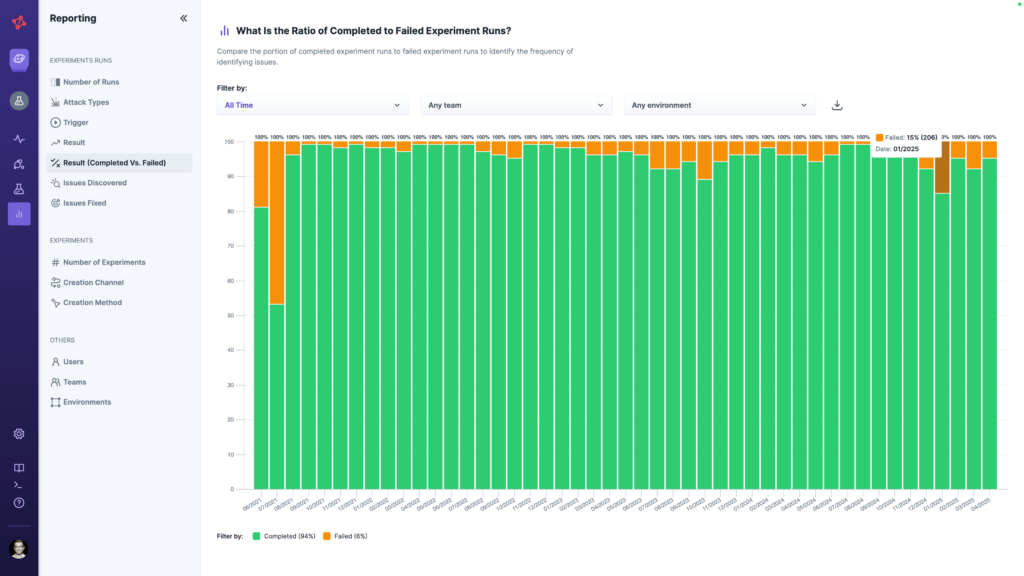
Trends matter. A drop in failed executions over the past quarter might signal better resilience. Or it might mean people are avoiding tougher scenarios. Either way, reporting shows you what’s changing over time, so you can dig deeper and ask better questions.
Identify where real issues were found

Not every failed experiment is bad news. In fact, failures often lead to your most valuable discoveries. Reporting helps surface which experiments uncovered real problems, making it easier to connect chaos engineering to real outcomes. This is the kind of evidence stakeholders remember.
Understand how experiments are being created
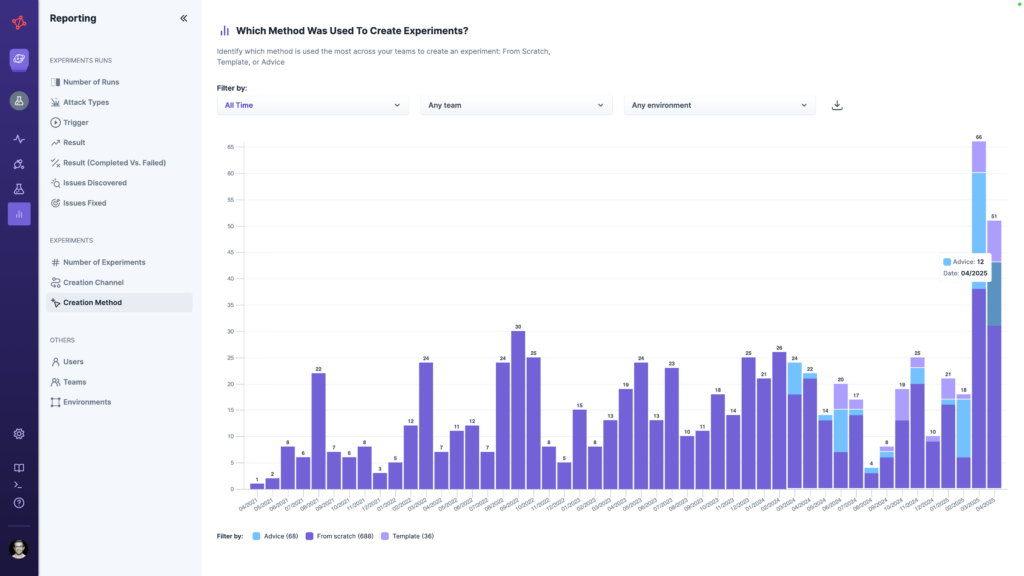
When teams create experiments using the templates you’ve provided, it shows they’re adopting best practices. When they don’t, you can find out why. Maybe the templates need improvement. Maybe they didn’t know about them. Either way, you now have a signal. And that leads to better enablement and more consistent testing.
Export and share reports easily
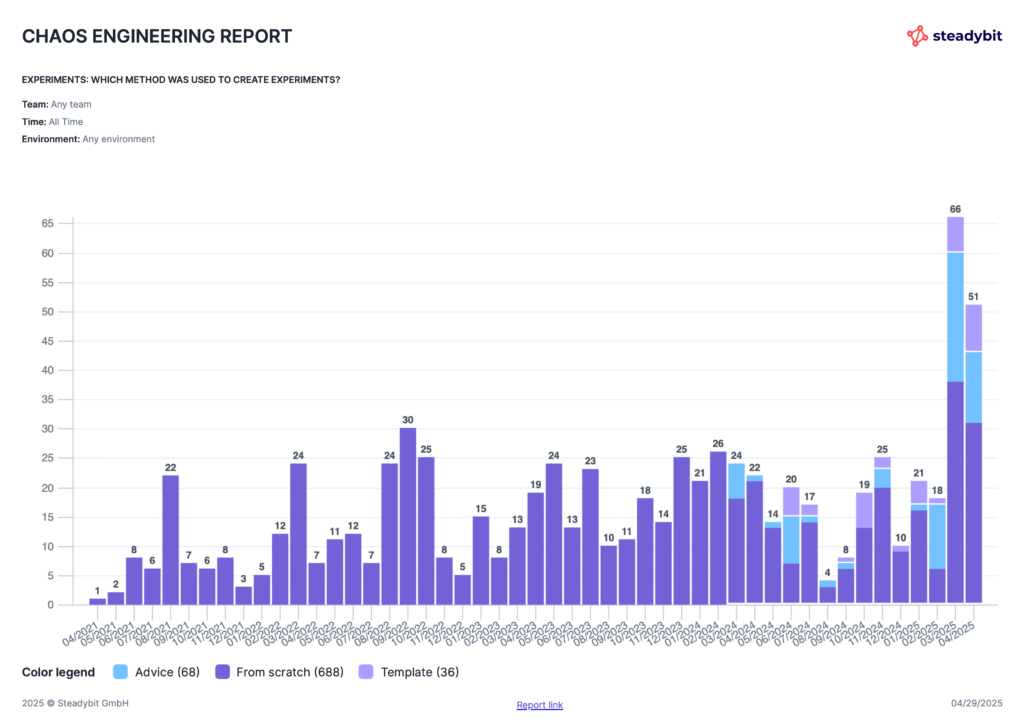
No extra formatting. No friction. Download as CSV if you want to dig into the raw numbers. Save as PDF or PNG if you need something executive-friendly. Or send a link directly. Whatever helps you share progress and keep people in the loop.
Built for real rollouts
Our goal in building Reporting wasn’t to provide vanity metrics. It was built to help you move forward. To prove what’s working. To uncover what isn’t. To keep the rollout going, even after the initial excitement fades.
And this is just the first version. More capabilities are already in the works.
If you’re ready to show what chaos engineering is doing for your org, Reporting is the place to start. Schedule a demo call to see how Steadybit could work for your organization.

Get started today
Full access to the Steadybit Chaos Engineering platform.
Available as SaaS and On-Premises!
or sign up with

Book a Demo
Let us guide you through a personalized demo to kick-start your Chaos Engineering efforts and build more reliable systems for your business!