Top 3 Kubernetes Weak Spots affecting your Availability
This blog post gives you an overview of the top 3 weak spots in Kubernetes and demonstrates an example to show how Chaos Engineering can be used to validate whether one’s cluster can withstand turbulent conditions in practice.
Prerequisites
For the practical part of this post, you need the following:
- A Kubernetes cluster. If you need a cluster, you can set up a local one by following these steps.
- An application running on Kubernetes. We use our Shopping Demo showcase.
- A tool to increase cpu consumption on nodes. We use steadybit for that in our example, but you can also use any other tool that is capable of doing that.
We all know, or at least all of us who are already running a Kubernetes cluster in production, that it is a pretty cool technology on the one hand, but it also brings in some additional complexity on the other. You need to be aware of some pitfalls to avoid availability and resilience issues.
Let’s take a look at the 3 most important areas that can help improve the availability of services running in Kubernetes. Of course, there are many other areas, but we will dig into these in a later article.
1. Single Pod Replica Count
When defining a ReplicaSet, deployment or similar, there is also a field “replicas”.
apiVersion: apps/v1
kind: Deployment
metadata:
    name: nginx-deployment
    labels:
        app: nginx
spec:
    replicas: 1
    selector:
        matchLabels:
            app: nginx
    template:
        metadata:
            labels:
                app: nginx
        spec:
            containers:
                - name: nginx
                    image: nginx:1.14.2
                    ports:
                        - containerPort: 80
This optional field specifies the number of desired pods. If the actual replica count deviates from this specification, for example if one or more pods fail, Kubernetes schedules new pods accordingly. However, often this specification is forgotten, and the default of 1 is used, which means that a failure can occur at any time if this single pod is suddenly no longer available. This is particularly relevant for services that are on the critical path. Without them the overall system will no longer function. Unfortunately, in a complex microservice architecture it is not always obvious which services are on the critical path and what minimum number of pods must be deployed to ensure the availability and performance of the application. To find out, it is recommended to do some experiments with the help of Chaos Engineering to be sure.
2. Missing Liveness and Readiness Probes
Liveness and readiness probes are essential for the successful operation of highly available and distributed applications.
Over time, services can get into a state where the only solution is to restart the affected service. Liveness probes are there for exactly this case. They perform a specified liveness check. This can be for example the call of a health endpoint or the execution of a check command. If this check is not successful, Kubernetes restarts the affected pod.
Example of a liveness probe:
apiVersion: apps/v1
kind: Deployment
metadata:
    namespace: steadybit-demo
    labels:
        run: gateway
    name: gateway
spec:
    replicas: 1
    selector:
        matchLabels:
            run: gateway-exposed
    template:
        metadata:
            labels:
                run: gateway-exposed
        spec:
            serviceAccountName: steadybit-demo
            containers:
                - image: steadybit/gateway
                    imagePullPolicy: Always
                    name: gateway
                    ports:
                        - containerPort: 8080
                            protocol: TCP
                    livenessProbe:
                        httpGet:
                            path: /actuator/health/liveness
                            port: 8080
The readiness checks are used, as the name suggests, to check whether the respective pod is ready to receive traffic.
To set the probes correctly, Kubernetes provides a number of options. In the above example we used the simple “httpGet” on a specific path. To verify that the probes are correctly configured and work like a charm, we recommend performing chaos experiments.
3. Missing Resource Limits
In addition to the improvement of availability through the “replicas” attribute and the continuous checking of the pods with regard to liveness and readiness, the last thing we look at is the resources of a pod. Of course, these can be limited by so-called resource limits and this is highly recommended, since we want to avoid that a memory leak or excessive CPU consumption heavily affects other pods on the same node or even make the entire host fail.
The following example shows the definition of CPU and memory limits:
apiVersion: apps/v1
kind: Deployment
metadata:
    namespace: steadybit-demo
    labels:
        run: fashion-bestseller
    name: fashion-bestseller
spec:
    replicas: 1
    selector:
        matchLabels:
            run: fashion-bestseller-exposed
    template:
        metadata:
            labels:
                run: fashion-bestseller-exposed
        spec:
            serviceAccountName: steadybit-demo
            containers:
                - image: steadybit/fashion-bestseller
            resources:
                requests:
                    memory: "256Mi"
                    cpu: "250m"
                limits:
                    memory: "2048Mi"
                    cpu: "1000m"
                imagePullPolicy: Always
                name: fashion-bestseller
                ports:
                    - containerPort: 8082
                        protocol: TCP
In this example the container of the pod has a request of 0.25 cpu and 256 MiB of memory, and a limit of 1 cpu and 2048 MiB of memory.
Now, the question arises how to verify whether the limit actually takes effect and also that other components on the same node aren’t too badly affected. A limit set too high can lead to undesired effects on other pods on the node (like being stopped due to failing liveness proves or being killed due to out-of-memory). Otherwise a limit set too low may prevent certain requests/batches from being ever completed successfully as they need that amount of memory/cpu.
As you might have guessed, running a chaos experiment will also help us a lot here and show us the possible effects when it comes to increased CPU and/or memory consumption.
CPU Experiment
Before we start with the experiment, we need a suitable application running on a Kubernetes cluster. For a quick start, we recommend installing our sample application in Minikube. Here you will find the necessary instructions to be up and running in a few minutes.
Our experiment is based on the following hypothesis:
When the CPU load increases up to 80%, the product service still returns a product list with no issues.
The target of our experiment is the “fashion-bestseller” service:
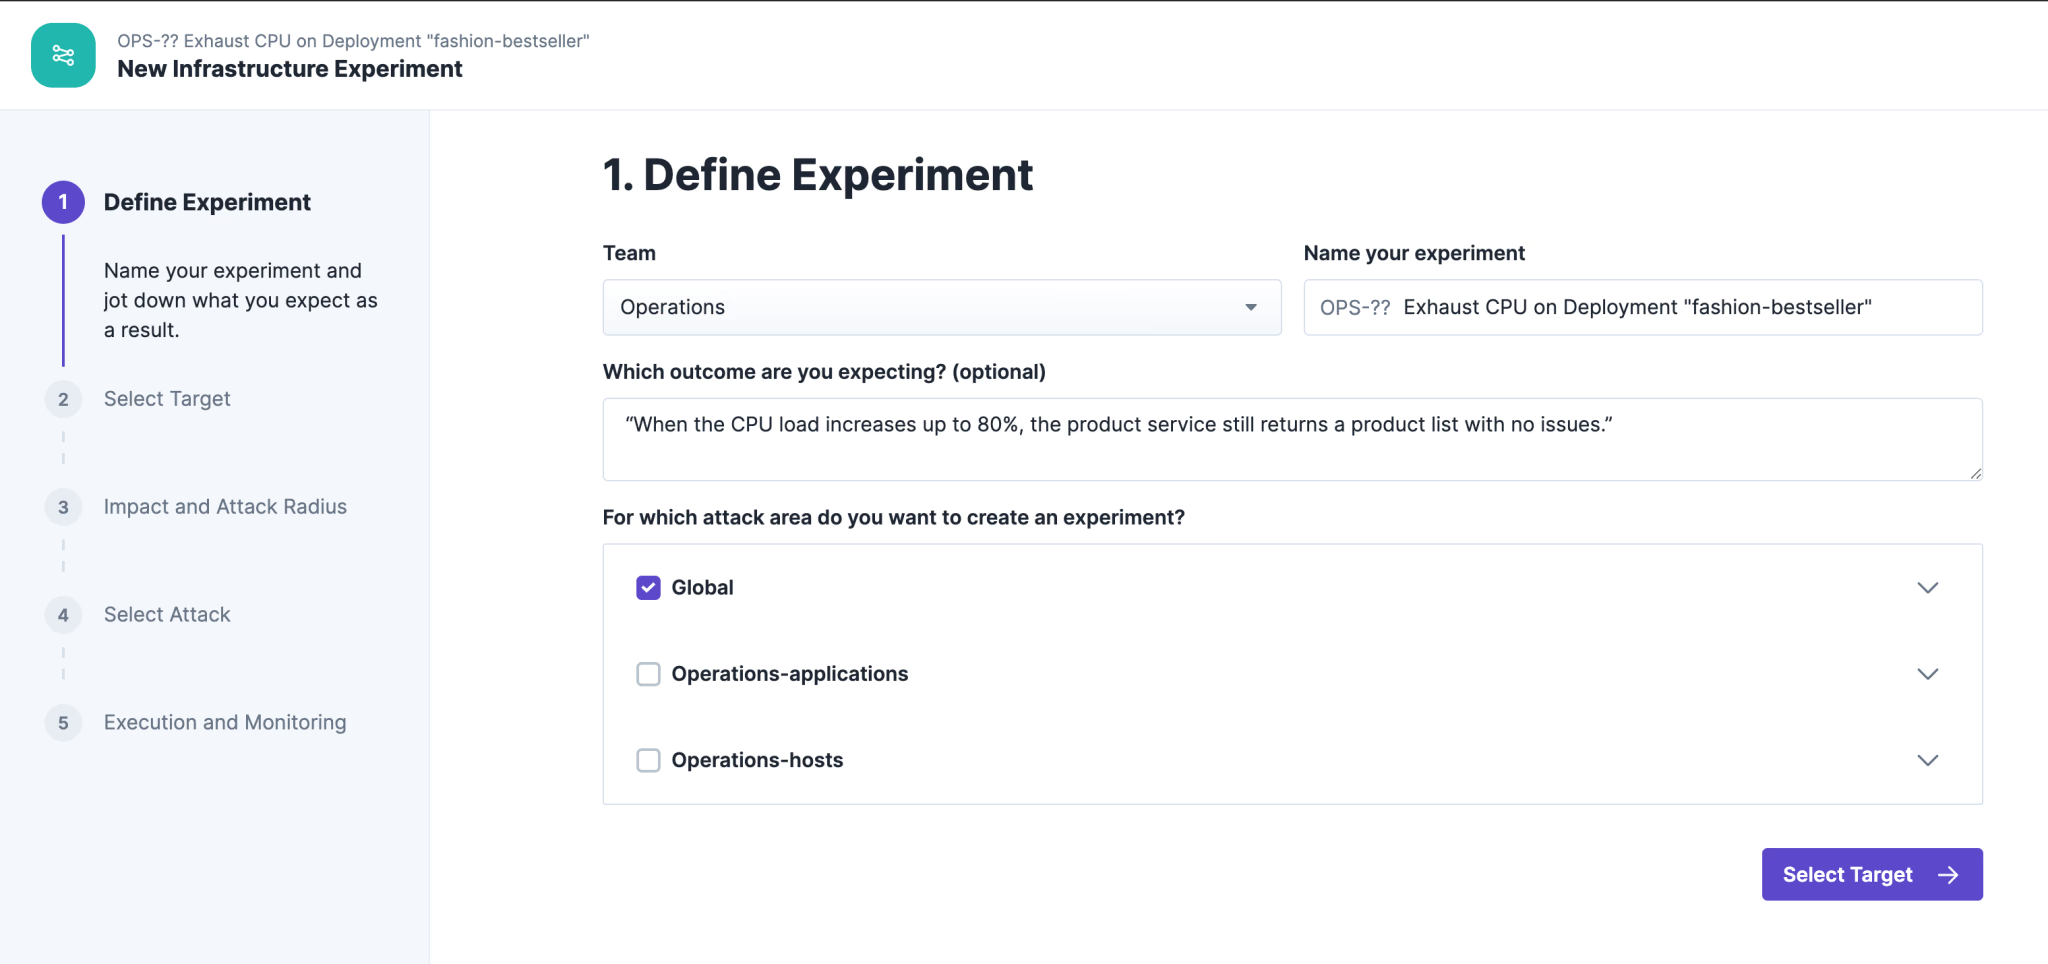
The target of our experiment is the “fashion-bestseller” service:
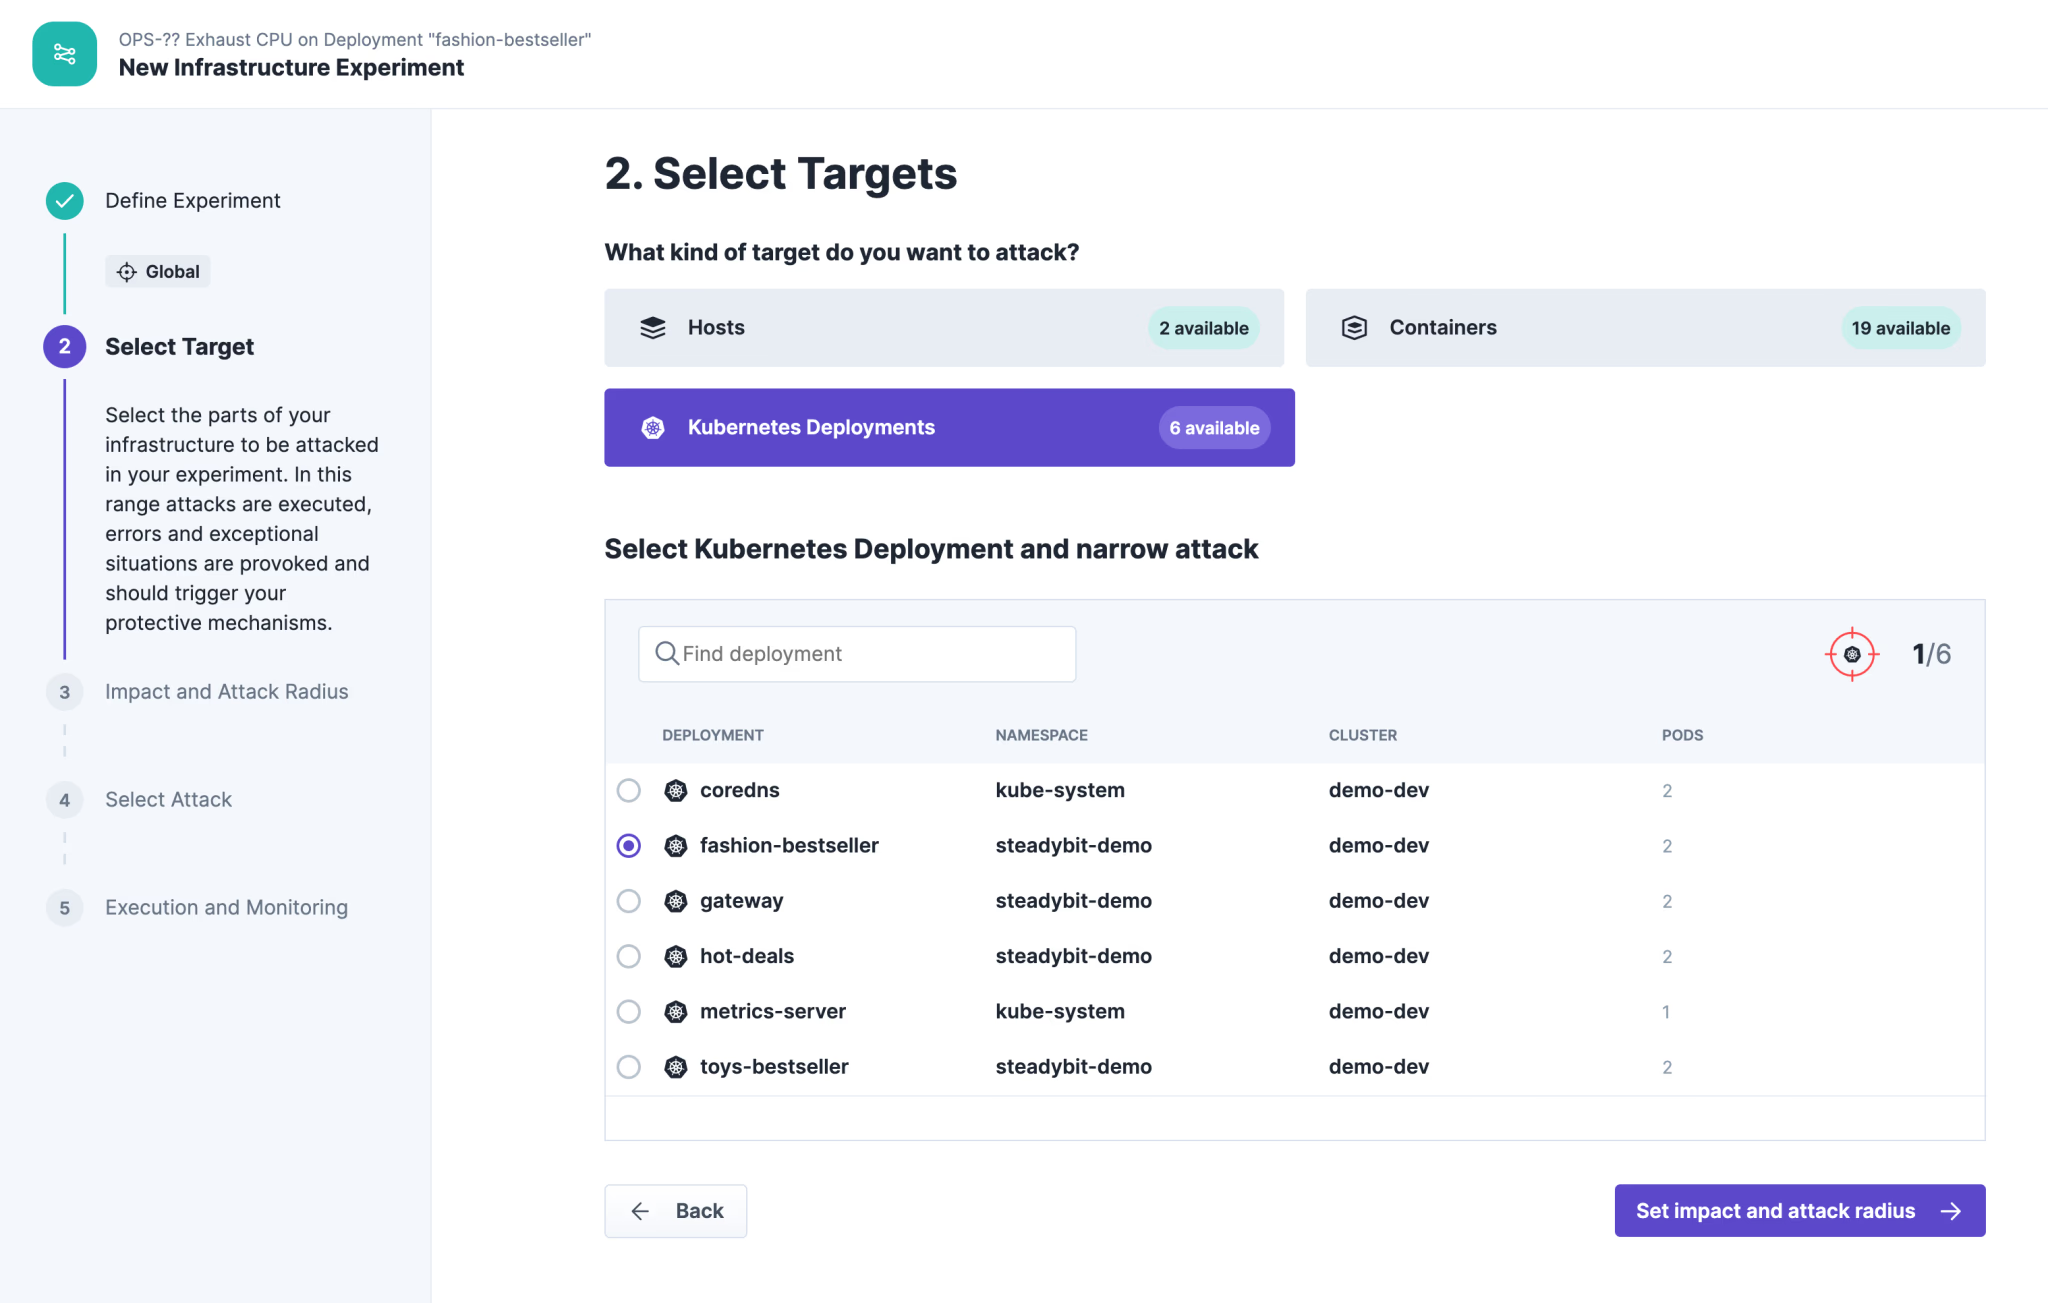
The blast radius includes all two pods deployed on the cluster:

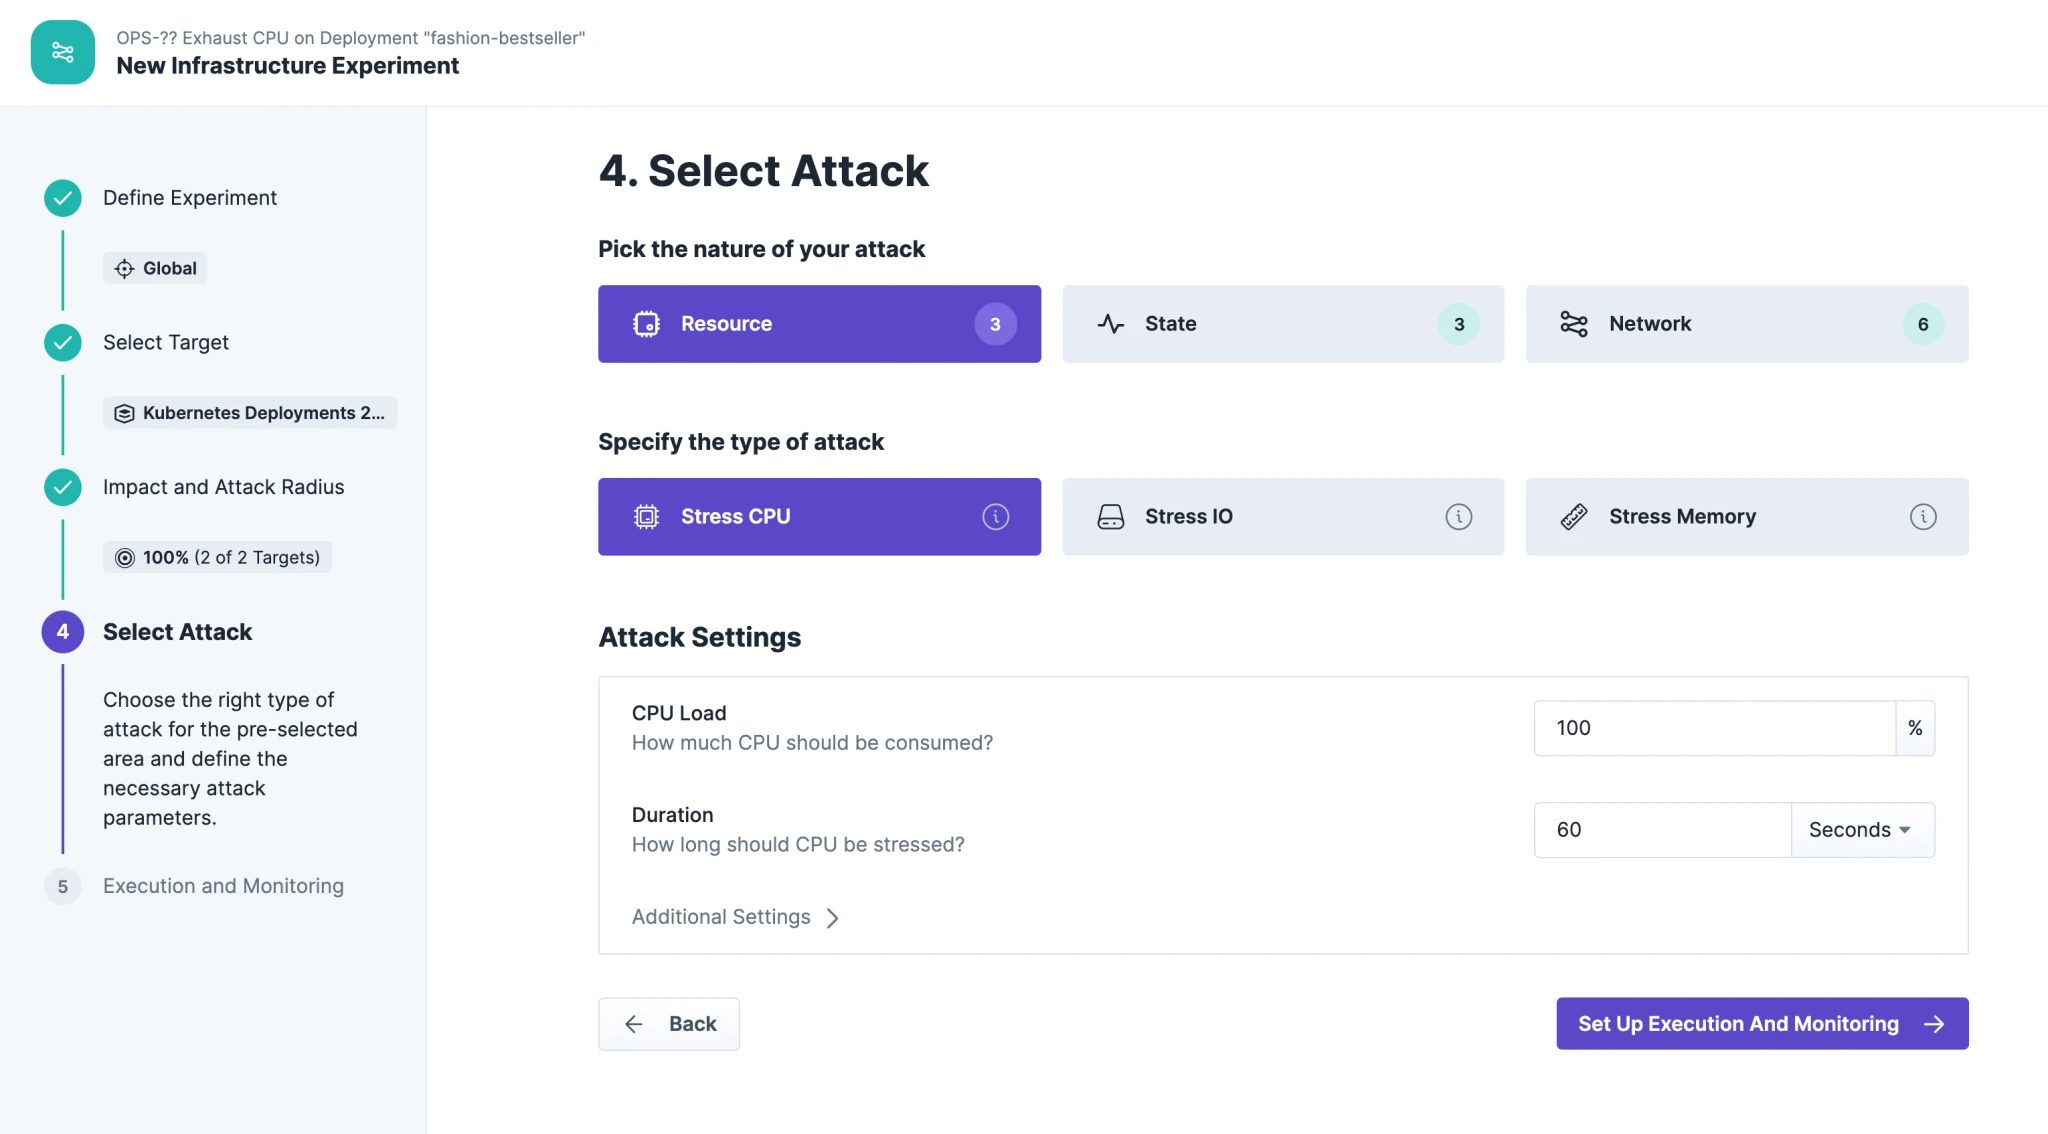
We increase the CPU utilization up to 100% for a duration of 60 seconds. That’s important for demo purposes to definitely see an effect during the experiment execution:
We check the steady state during the experiment with a simple HTTP check by querying the product list from our shopping demo:
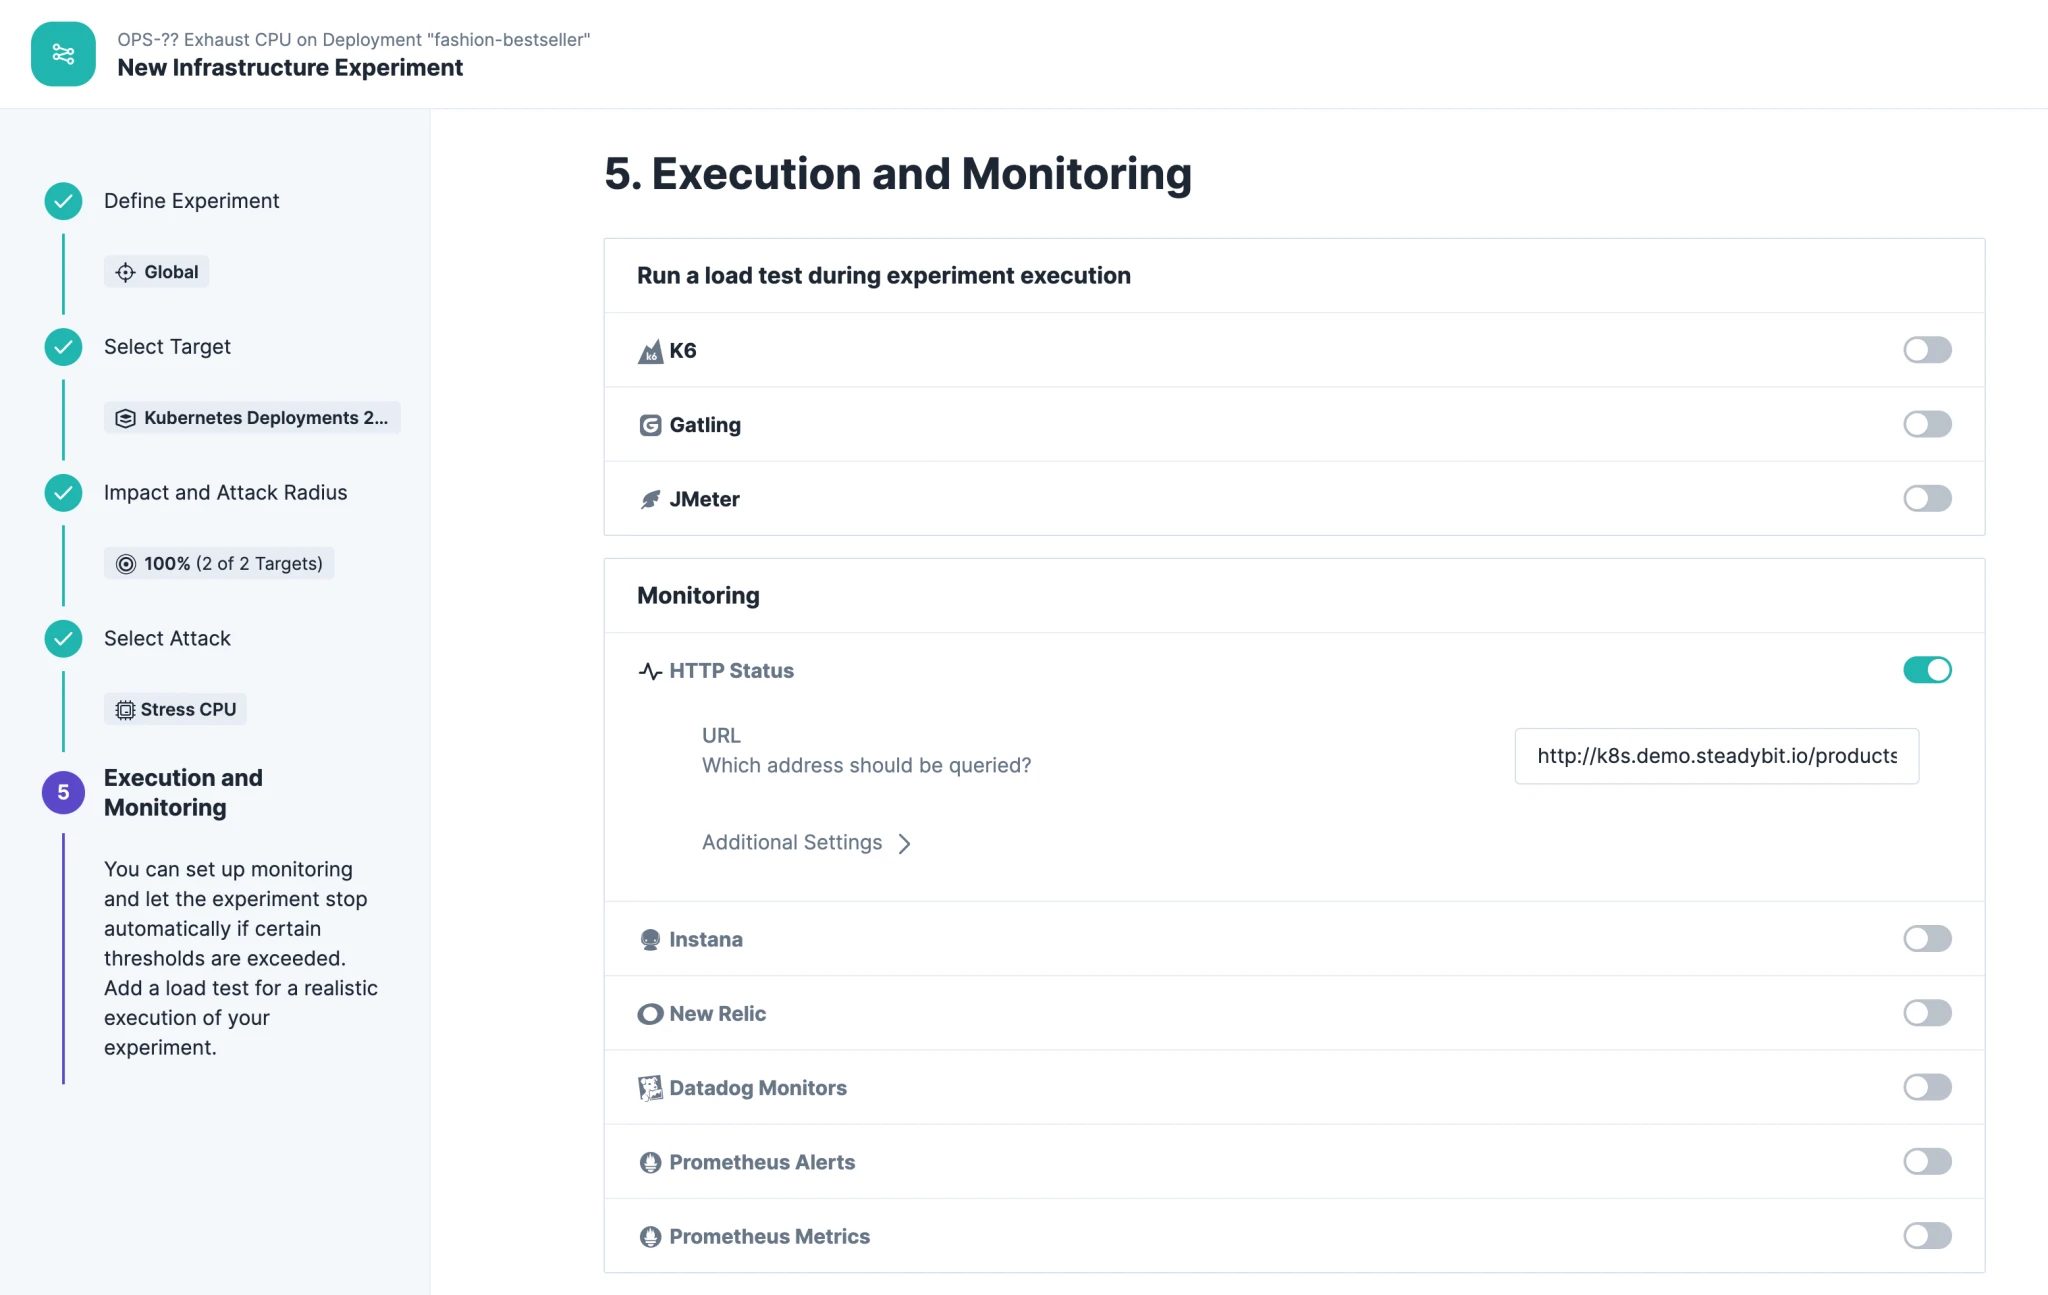
Run Experiment
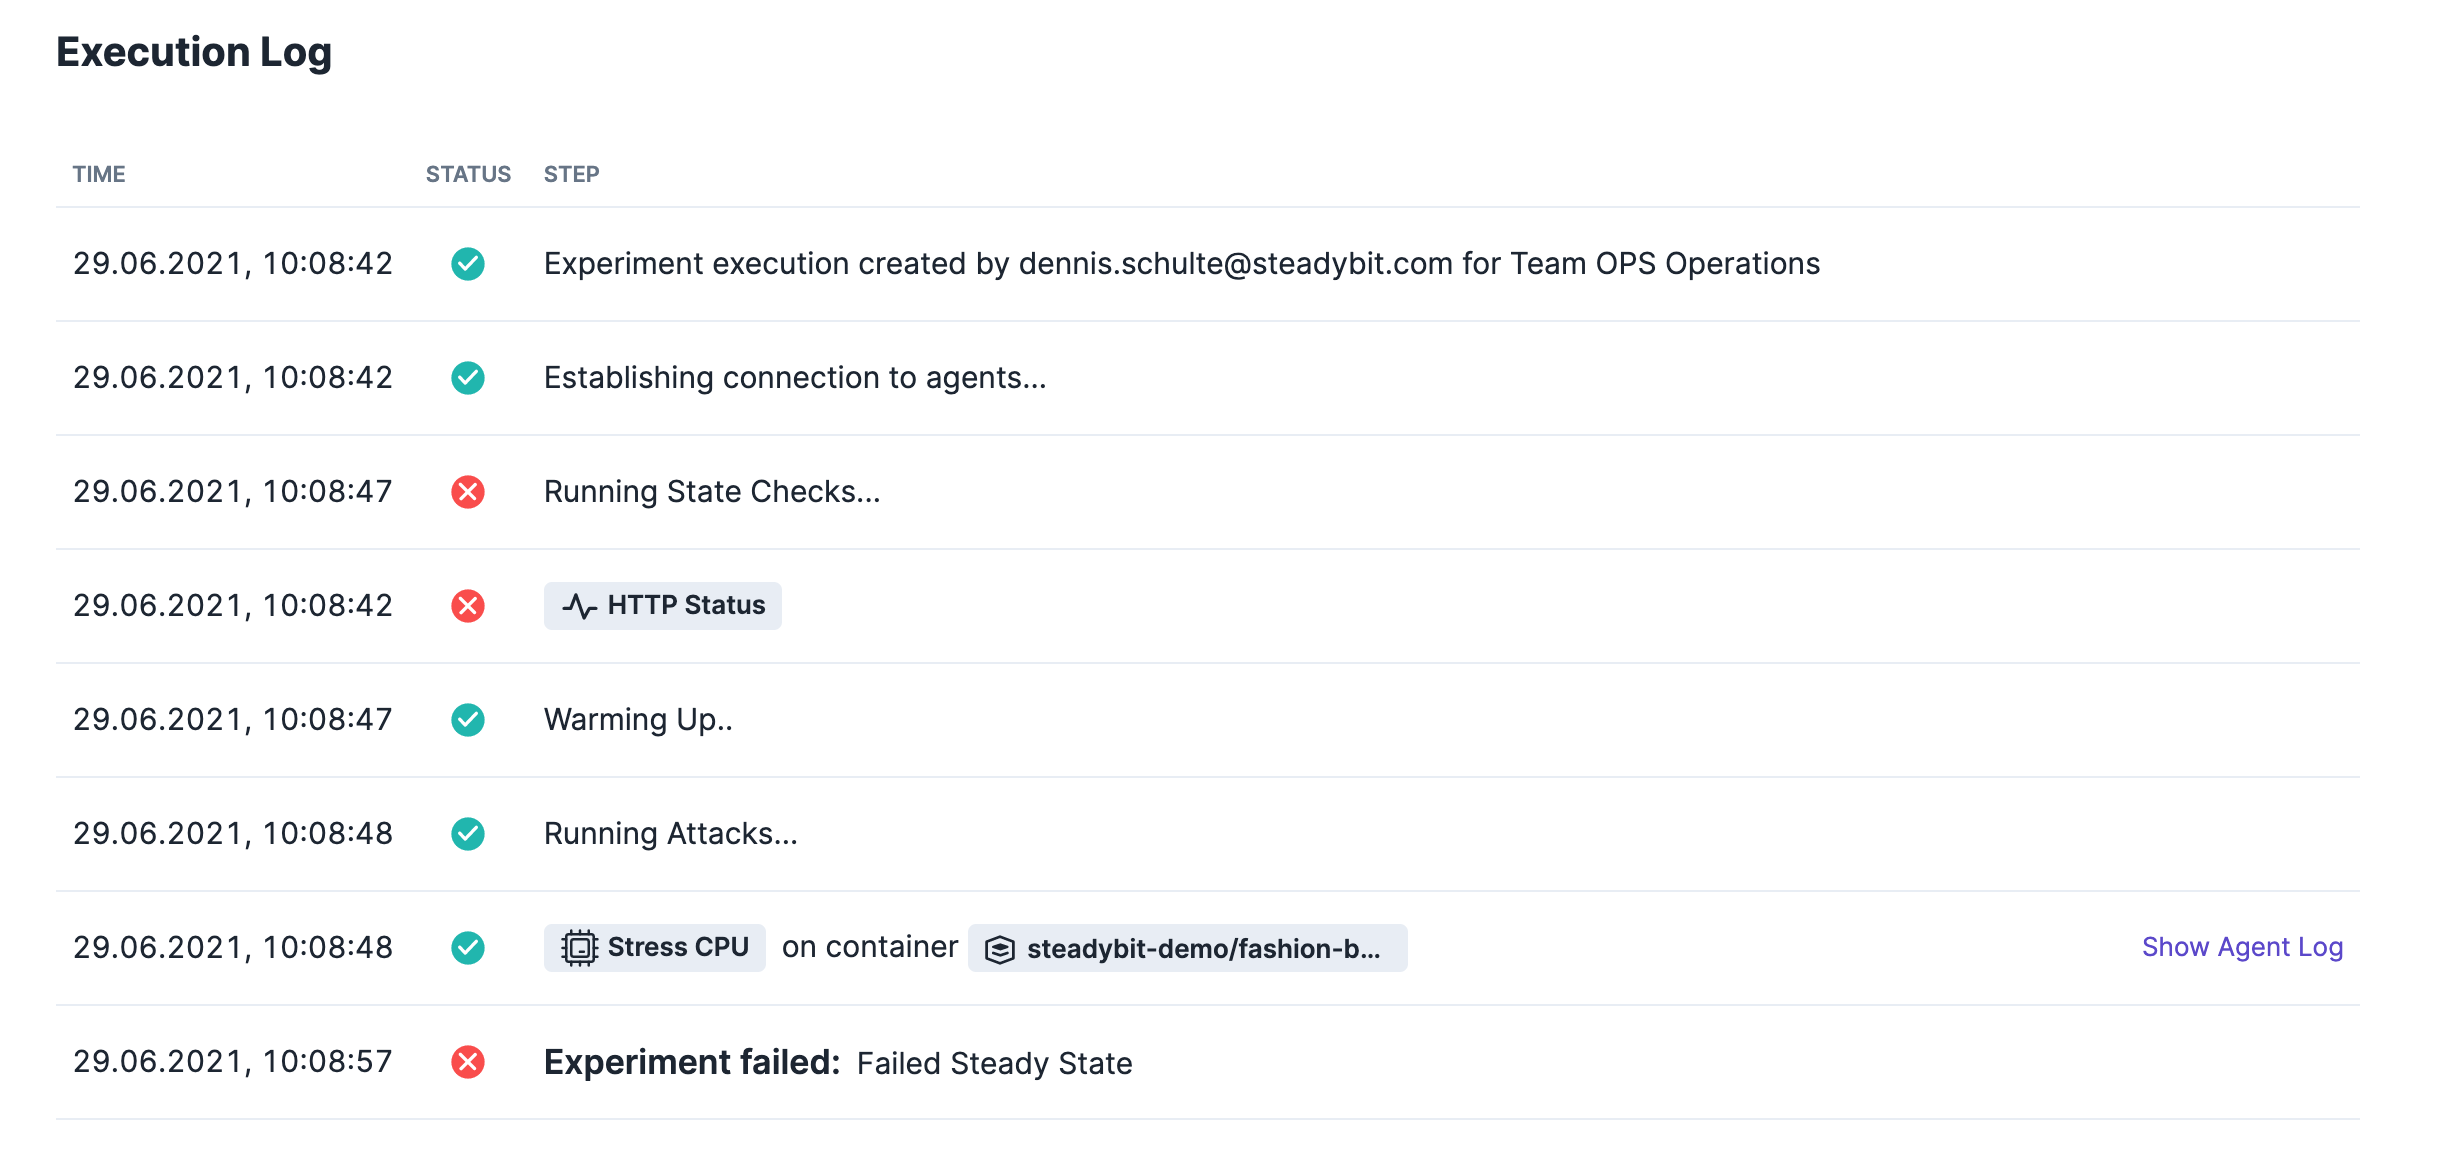
Running the experiment yields to a failed result.
Conclusion
As you can probably imagine right now, it should not happen that timeouts occur when the CPU consumption is suddenly increased by a service. The definition of CPU resource limits is therefore strongly recommended for every service in your cluster. Even though this is a simple example, it is meant to illustrate that turbulent conditions can occur at any time and that the only way to prepare for them is to actually simulate this in a controlled way with chaos experiments.
So we had ad look at these weak spots in Kubernetes:
- Single Pod Replica Count
- Missing Liveness and Readiness Probes
- Missing Resource Limits
What are your top weak spots in Kubernetes?

Get started today
Full access to the Steadybit Chaos Engineering platform.
Available as SaaS and On-Premises!
or sign up with

Book a Demo
Let us guide you through a personalized demo to kick-start your Chaos Engineering efforts and build more reliable systems for your business!