
Safe and Observable by Design: Chaos Engineering with Steadybit
Introduction
Chaos engineering has a reputation problem. Say “let’s inject faults into production” in a meeting and watch the room go quiet. And honestly, that reaction is healthy. Before anyone lets an experiment near real traffic, two questions need a good answer: what stops the damage if something goes wrong? And how do we see what actually happened?
At Steadybit, we believe these questions shouldn’t be answered with “trust us.” They should be answered by the product itself. That’s why safety and observability are built into every layer of the platform, from the UI down to each extension.
In this blog, we’ll walk through both pillars:
- Safe: an emergency stop anyone can press, attacks that roll themselves back, access control that caps the blast radius, and preflight checks that can veto a run before it even starts.
Observable: experiment events in the tools your SREs already watch, checks that judge the experiment live, reports that outlive the run, and OpenTelemetry traces from agent to extension.
And here’s a little spoiler: none of this assumes a human is the one pressing Run. Keep that in mind, we’ll come back to it at the end.
Safety First: The Emergency Stop
Picture this: an experiment is running, and suddenly the checkout latency graph turns red. Was it the experiment? Something else? At that moment, it doesn’t matter. The first reflex should be to stop everything, right now.
That’s exactly what the Emergency Stop does. Every authenticated user can press it from the Current Activities panel, no matter which team started the experiment.
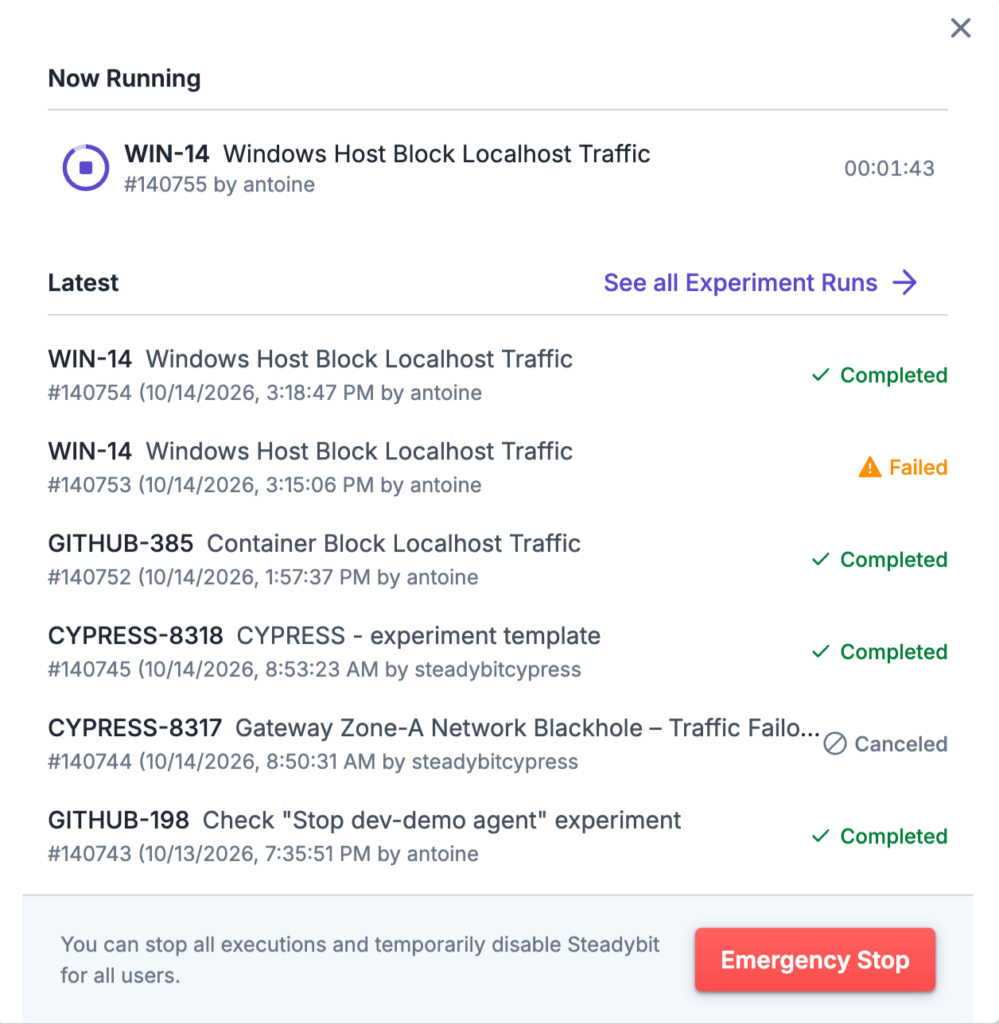
One click, two effects:
- All running experiments are stopped and their attacks are rolled back.
- New runs are blocked, from the UI, the API and schedules alike, until someone releases it.
Notice the asymmetry: you need to belong to a team to design or run an experiment, but anyone can stop one. Your on-call engineer at 3 a.m. shouldn’t have to find out who owns an experiment before stopping it.
And of course, pulling the kill switch is observable too. It fires the killswitch.engaged and killswitch.disengaged webhook events and lands in the audit log.
Attacks That Clean Up After Themselves
A kill switch is great, but it needs someone watching. What happens when nobody is? Or worse, when the network between your infrastructure and Steadybit simply disappears in the middle of an attack?
This is where the most important guarantee comes in: every attack ends on its own. We built several independent safety nets, each owned by a different component, so that no single failure can leave a fault behind:
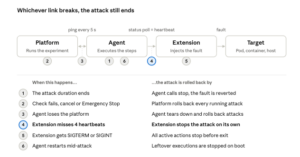
Each number sits on the component, or the link, that owns that safety net. The agent pings the platform every 5 seconds by default, and polls each running action’s status, which doubles as the extension’s heartbeat.
That extension-side heartbeat deserves a special mention. Every extension built on our action-kit gets it for free, which means an attack doesn’t even depend on the agent staying alive, let alone the platform or the network in between. Think of it as a dead man’s switch for every fault you inject.
To be fully transparent: some actions can’t be undone by nature. Once a container is stopped or a pod deleted, recovery is your orchestrator’s job, and that’s precisely what those experiments are designed to verify!
Limiting the Blast Radius with Teams and Environments
The safest attack is the one a team was never allowed to start in the first place. Rather than relying on good intentions, Steadybit narrows what any experiment can touch through four nested layers, like Russian dolls:
- Environments: admins define environments as queries over discovered targets, for example
k8s.cluster-name="shop-staging". This is the upper limit of what any experiment in it can attack. - Teams: each team is granted specific environments and a specific list of attacks, the maximum blast radius this team can attack. No Stop Container in the list? No Stop Container in the experiment.
- Target selection: within its environment, an experiment selects its targets by query.
- Blast radius limits: finally, only a random subset gets attacked, as a percentage, a fixed number, or grouped hierarchically, like one pod per zone.
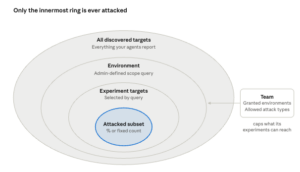
Each ring sits inside the previous one: an experiment can never reach past the environments its team was granted, and only the innermost subset is actually attacked.
Roles are deliberately simple: admins manage environments, agents and the audit log, team owners manage members and integrations, and team members design and run experiments. And as we saw earlier, everyone can stop.
Two details make this hold up at scale. First, removing a permission never widens the blast radius of an existing experiment. Second, teams and environments can be managed as code with the Steadybit CLI. Giving a team access to production then becomes a reviewed pull request instead of a click in a settings page.
A friendly piece of advice: the default Global environment contains every discovered target. It’s perfect for a trial, but dangerous in the long run. Create your own scoped environments early!
Preflight Actions: Is Now a Good Time?
RBAC answers who may attack what. But it can’t answer a much trickier question: is now a good time? Maybe there’s an ongoing incident, a release in progress, a change freeze before Black Friday, or an error budget already burned. Only your organization knows.
This is where preflight actions step in. Before any experiment starts, Steadybit calls every configured preflight and hands it the list of targets about to be affected. If one of them says no, the run fails and not a single target is attacked.
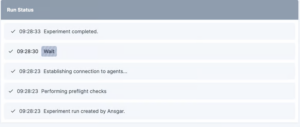
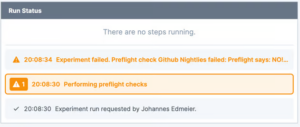
And here’s what it looks like when a preflight says no. The Github Nightlies preflight rejected the run during Performing preflight checks, with its own message displayed as the failure reason. No agent contacted, no target touched.
Preflights are regular extensions built with our preflight-kit, so you can encode any rule you can program:
- Only run inside an approved maintenance window (our extension scaffold ships this one as an example).
- Block runs while your incident tool has an open incident on the affected services.
- Block runs during a release freeze declared in your calendar or CI.
Refuse targets tagged tier=critical without a signed-off change request.
And they don’t have to stop at the starting line! With the while the experiment is running trigger, a preflight is re-evaluated at a regular interval and stops the experiment as soon as its answer turns to no.
Don’t want to write an extension? Preflight webhooks do the same job with a plain HTTP endpoint: any non-2xx response, or no answer within 55 seconds, and the experiment won’t start. Both are enterprise features.
Seeing Steadybit Events Where You Already Look
Let’s switch to the second pillar. The worst way to find out a chaos experiment is running? Getting paged for the latency it caused.
That’s why Steadybit pushes experiment events straight into the observability tools you already use. Event listeners are part of our extension model, built on event-kit, and today they ship with our Datadog, Dynatrace, New Relic and Grafana extensions. Every experiment start and end, and every attack start and end per target, shows up enriched with everything you’d want to filter on: experiment key, name and hypothesis, execution ID and final state, team, environment, action, target, and who (or which schedule) started it.
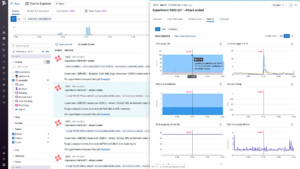
Let’s see it in action! In Datadog, filter the Events Explorer on source:steadybit and every experiment and attack is listed with its host, service and target. Open one, and Datadog overlays it on the host metrics. Can we correlate the Stress CPU attack with the CPU and load spike at 11:15? Absolutely! By the way, Steadybit is also available on the Datadog Marketplace.
In Grafana, the experiment appears as an annotation over your existing panels. Here, the purple area marks a Container Delay Traffic experiment and its steps, drawn on top of the request latency graph. The jump from around 300 ms to over 1 second matches the attack window perfectly.
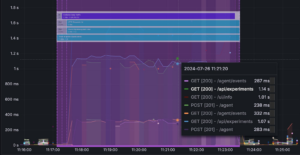
Each annotation carries the same tags you’d filter on: source, environment, event type, tenant, team, execution ID, and experiment key and name.

Using another tool? Webhooks and Slack notifications cover the rest: experiment created, started, step finished, ended, kill switch engaged… each one fires an event your chat, incident or ITSM tooling can consume.
Checks That Judge Your Experiment in Real Time
Events tell your monitoring tools about Steadybit. But the opposite direction matters just as much: Steadybit can pull signals from your tools into the experiment, and act on them.
While a run is in progress, the run view puts the timeline of steps right next to your system’s reaction: Kubernetes ready pods and events, HTTP response times and status codes, and the events and alerts raised by your monitoring extensions. Extensions can also stream metrics, such as Prometheus query results, on the same timeline as the attacks.
Checks turn these signals into a verdict. They usually run in parallel with the attack, for example:
- HTTP Call: fails when the success rate or response time misses its threshold.
- Datadog Monitor Status: fails when a monitor leaves its expected status.
- Dynatrace Problem Check: fails when Dynatrace opens a problem.
- Prometheus Metric Check: fails when a PromQL expression crosses its condition.
Kubernetes Deployment Rollout Status: fails when a deployment doesn’t finish rolling out.
This is where observability and safety become two sides of the same coin. A failed check marks the run as failed and triggers the very same rollback as a cancel. An experiment that pushes your checkout error rate beyond your SLO stops itself, without waiting for a human to notice.
And Steadybit itself is observable too! Both the platform and the agent expose Prometheus metrics (attacks started and completed, queue lead times, registrations…), and our docs ship the Grafana dashboard and alert rules we use to operate Steadybit SaaS.
Reports and an Audit Trail That Outlive the Run
A chaos engineering program is rarely judged on a single run. It’s judged months later, by people who weren’t watching: auditors, platform leads, management. And they all ask for the same thing: evidence.
Steadybit keeps it at three levels:
- Every run keeps its timeline, its states per step and per target, the exact parameters and targets used, its logs and metrics, and who or what triggered it. The run history can be filtered by team, environment, outcome or time, and exported as CSV.
- The whole program is covered by built-in reporting. How many runs, which attacks, triggered how (UI, API, CLI or schedule)? How often do experiments surface an issue, and how often is it fixed afterwards? How is service risk trending across reliability categories like redundancy or scalability? Every chart can be filtered and downloaded as CSV, PNG or PDF, ready for your next quarterly review.
- Every sensitive action lands in the audit log: who ran what, against which hosts, and when was the kill switch pulled? It’s available through the
/api/audit-logendpoint, retained for 90 days on SaaS and configurable on-prem, so you can ship it to your SIEM.
One Trace From Agent to Extension with OpenTelemetry
Events and reports tell you what happened. But sometimes you need to know exactly how: which extension call took 3 seconds? Why was this target skipped? For that, you need traces.
The Steadybit agent and every extension built on our extension-kit are instrumented with OpenTelemetry. Point them to your OTLP endpoint using the standard OTEL_* environment variables, and every experiment run becomes a distributed trace in Tempo, Jaeger, Datadog or any other OTLP-compatible backend. No proprietary pipeline, no new agent to run, and Steadybit never stores your traces itself.
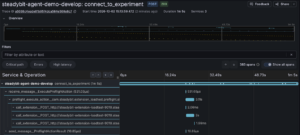
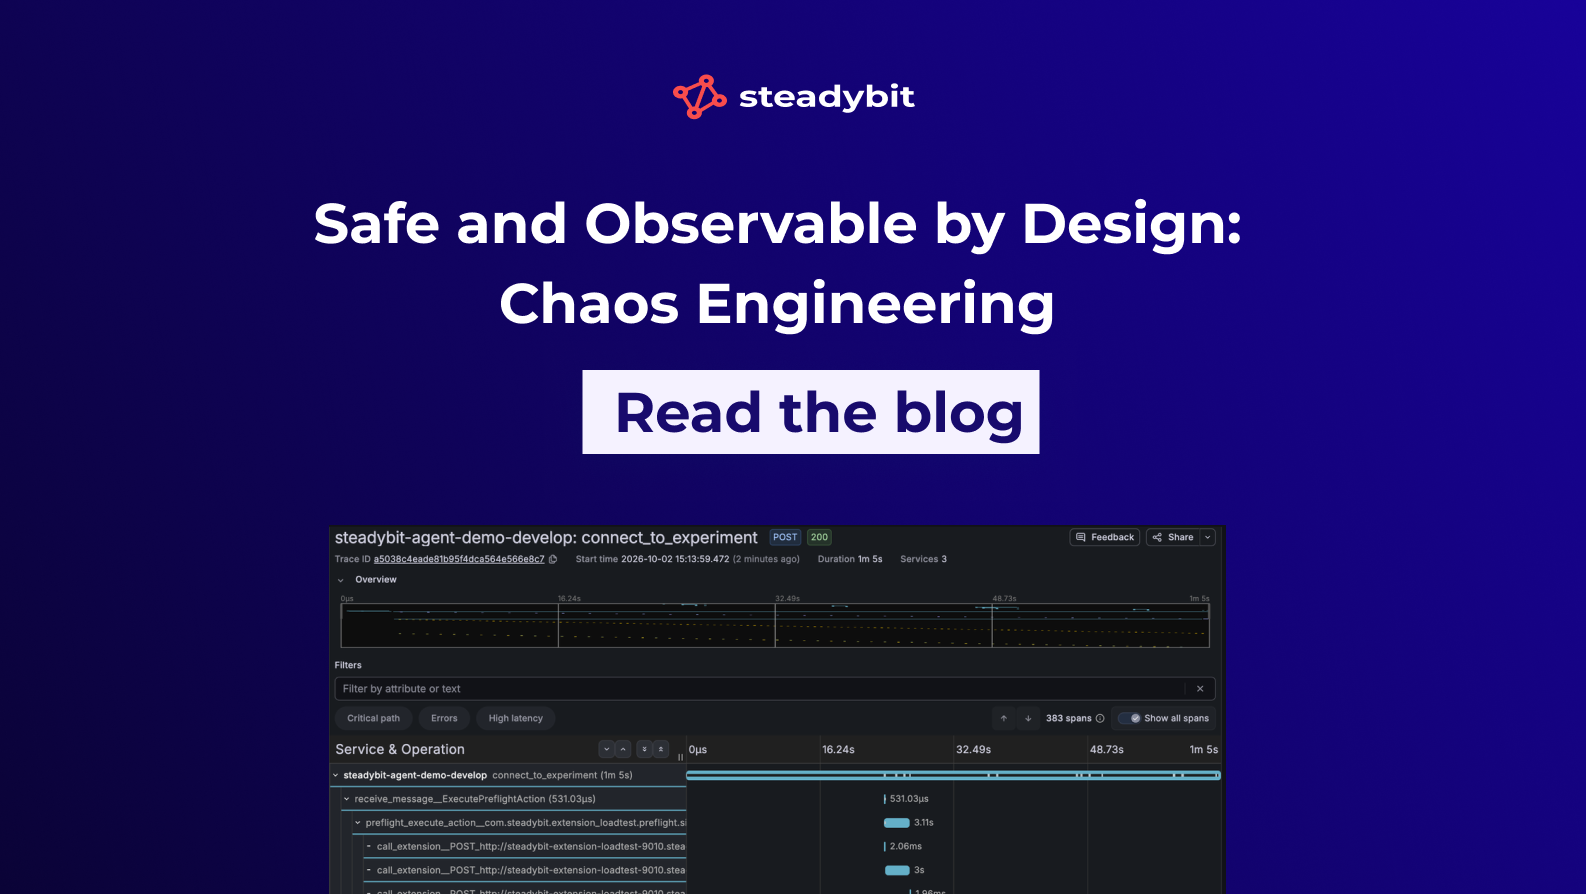
Here’s a real run on our own cluster: a single trace with 383 spans across 3 services. And look closely, our preflight action from earlier is right there! The agent receives ExecutePreflightAction, calls the extension three times, and sends back the result.
Finding the right trace is easy: every span carries an experiment.execution.id attribute, and the Tracing tab of the run view hands you the query with the ID already filled in, for Tempo, Jaeger and Datadog.
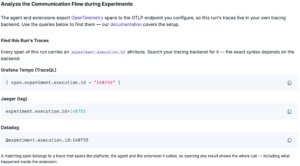
This comes in handy when debugging your own extension, when correlating a run with the rest of your telemetry, or when you need help from our support team: one trace link says more than a pile of logs! Tracing is off by default, so remember to enable it for the agent and for each extension you care about.
Conclusion
Safety and observability aren’t two separate checklists. Checks read your observability data to trigger rollbacks, preflight actions and the kill switch show up as events and spans, and the audit log records every safety decision along the way.
If you’re rolling out chaos engineering, here’s the order we’d recommend:
- Replace the Global environment with scoped environments, and only give each team the attacks it needs.
- Install the extension for your monitoring tool, so every experiment shows up on your dashboards.
- Add at least one check to every experiment, so it can stop itself.
- Add a preflight action encoding your own rule of when not to run.
- Turn on OpenTelemetry, and make sure everyone knows where the Emergency Stop is!
Then go break things, on purpose, and with a safety net.
What’s Next: Reliability Findings with Your Morning Coffee
Imagine starting your day with a short report: three experiments ran overnight inside your maintenance window. Two passed. One found that your checkout service doesn’t survive losing a zone. And nobody had to remember to schedule them. That’s where we’re taking SteadyBuddy next.
SteadyBuddy, our AI assistant, already helps you design experiments, understand failed runs and find what to test next. We’re now building an auto mode: SteadyBuddy picks an experiment based on the reliability gaps it finds, runs it, analyzes the outcome and decides what to try next.
An agent running experiments on its own raises the same two questions as a new engineer joining the team: what stops it from doing damage, and how do we see what it did? Good news: the foundation is already in place, because all the guardrails we’ve covered don’t care who presses Run:
- RBAC and environments: SteadyBuddy acts on behalf of a team, with that team’s permissions. No access to an environment or an attack? No experiment.
- Preflight actions: your rules still apply. Only during the night-time maintenance window, never during an open incident, never during a release freeze.
- Checks and automatic rollback: a breached SLO fails the run and reverts the attack. So does a lost connection, whether someone is awake or not.
- Emergency Stop: your on-call engineer can still stop everything with one click.
- Events, traces and audit log: every experiment run by the agent shows up in Datadog or Grafana, in your tracing backend and in the audit trail, like any other run.
That said, an autonomous agent deserves more than guardrails designed for humans. On top of this foundation, we’re adding guardrails dedicated to agentic usage, so you decide exactly how much SteadyBuddy can do on its own, where, and when.
Auto mode is under active development. Want to be among the first to try it? Let us know! 💡
In the meantime, explore all the integrations mentioned in this post in our Reliability Hub, and find every setup detail in our documentation.

Get started today
Full access to the Steadybit Chaos Engineering platform.
Available as SaaS and On-Premises!
or sign up with

Book a Demo
Let us guide you through a personalized demo to kick-start your Chaos Engineering efforts and build more reliable systems for your business!