Level Up Your Monitoring: Splunk and Steadybit Join Forces
After Prometheus, Grafana, Dynatrace, Datadog, Instana, and Stackstate, we’re excited to announce yet another addition to our growing list of observability integrations: Splunk!
With Splunk Observability Cloud, you have the flexibility to define Detectors and SLOs tailored to your needs.
Detectors in Splunk aren’t just typical monitors—they can be enhanced using SignalFlow or dynamic threshold conditions for a more powerful and responsive setup. Similarly, SLOs can effortlessly be created from standard or custom metrics, such as those originating from synthetic tests.
As you set up your Detectors and SLOs in Splunk, wouldn’t it be great to validate their behavior under chaos conditions? This is precisely where Steadybit steps in.
Testing Splunk SLOs with Steadybit
Let’s sprinkle a little chaos into your systems to test their resilience. How will your Detectors react? Will they turn red immediately, remain stable, or oscillate unpredictably between states? The only sure way to know is through direct experimentation.
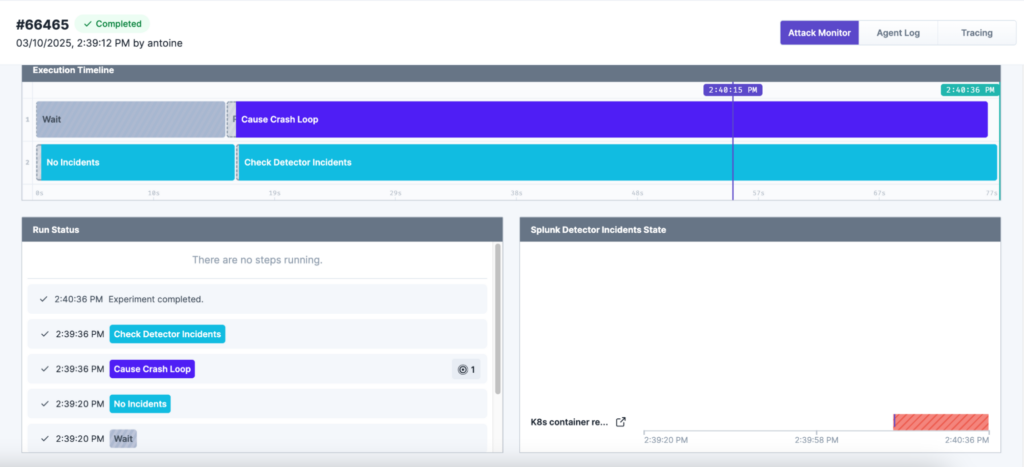
Connecting observability and chaos engineering—two essential sides of the same coin—we conducted a simple experiment: creating a crash loop backoff scenario in a Kubernetes pod. Perhaps a new Docker tag was released without an essential environment variable, or maybe a default value was overlooked.
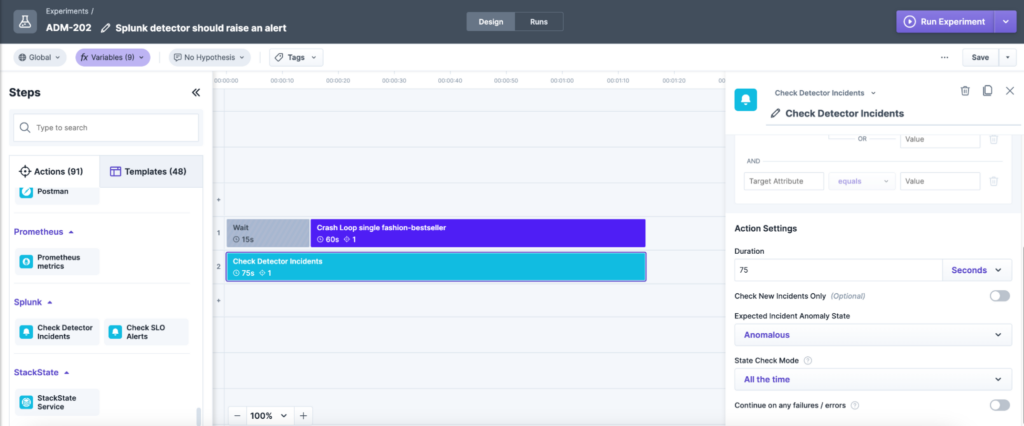
As expected, our Splunk Detector quickly identified the anomalous behavior, triggering an alert in just 1 minute and 5 seconds. This gives you a practical and efficient way to fine-tune your Detectors based on your application’s criticality.
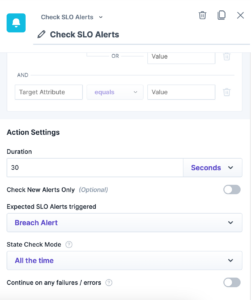
The same principle applies to your SLOs. Easily test their thresholds, observe when they’re breached, track your error budget, or see how quickly it’s depleted under various conditions.
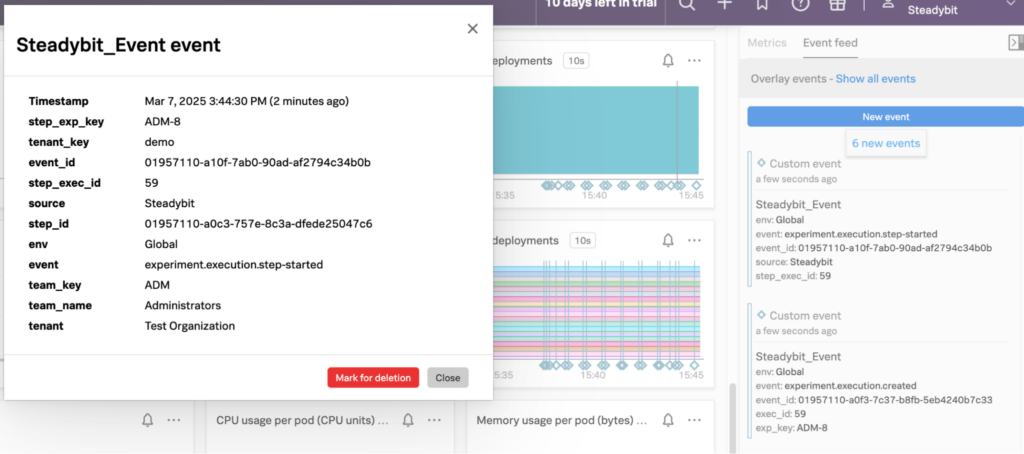
Viewing Steadybit Events in Splunk
Finally, Steadybit also pushes experiment data directly into Splunk Observability Cloud. This allows seamless correlation between Steadybit’s chaos experiments (recorded as custom events) and your Splunk events, further enhancing your observability and operational insights.
Connecting Steadybit Across Your Tech Stack
Combining the capabilities of Splunk and Steadybit makes it easier than ever to test and validate the performance of your systems.
Like with our Splunk Extension, you can also connect Steadybit with tools across your tech stack.
For example, you can connect load testing tools like JMeter and K6, cloud providers, or API platforms like Kong and Postman.
If there is a tool you want to connect that doesn’t already have an extensions available in our Reliability Hub, you can also easily create your own custom extensions with our Extension Kits.

Get started today
Full access to the Steadybit Chaos Engineering platform.
Available as SaaS and On-Premises!
or sign up with

Book a Demo
Let us guide you through a personalized demo to kick-start your Chaos Engineering efforts and build more reliable systems for your business!