Validate your Kubernetes Resource Limits with Chaos Engineering

Do you have defined resource limits for your Kubernetes resources? We hope so! Learn in this post if they are correctly defined and Kubernetes does the expected things when they are reached.
Prerequisites
For the hands-on part of this post, you need the following:
- A Kubernetes cluster. If you need a cluster, you can set up a local one by following these steps.
- An application that runs on Kubernetes. We use our Shopping Demo showcase application.
- A tool to increase the resource consumption for a Kubernetes service on a node. We use Steadybit for that in our example, but you can also use any other tool that is capable of doing that.
Basics
The two most important resources used by any software are CPU and memory. In today’s world of software engineering using cloud computing these seem to be unlimited available resources as application developers usually don’t need to care too much about them.
Even so, at some point software meets the physical computer where it is executed. Looking at one physical computer these resources are in fact limited. The worst case would be an unlimited consumption of one application affecting other applications running on the same computer. Thanks to Kubernetes we can limit available resources per application by using resource limits. Having defined resource limits per Kubernetes pods prevents side effects of one pod having e.g. a memory leak and affecting pods running on the same node negatively.
Let’s discover the difference in this blog post by using Steadybit.
Validate CPU limits with an Experiment
Since the number of pods can change dynamically at any time and the total number of components in a distributed system continues to increase from an architectural perspective (keyword: microservices), it also becomes increasingly difficult to monitor and control resource consumption.
But for now, let’s do an experiment and see what happens if we suddenly increase CPU consumption a lot for a pod.
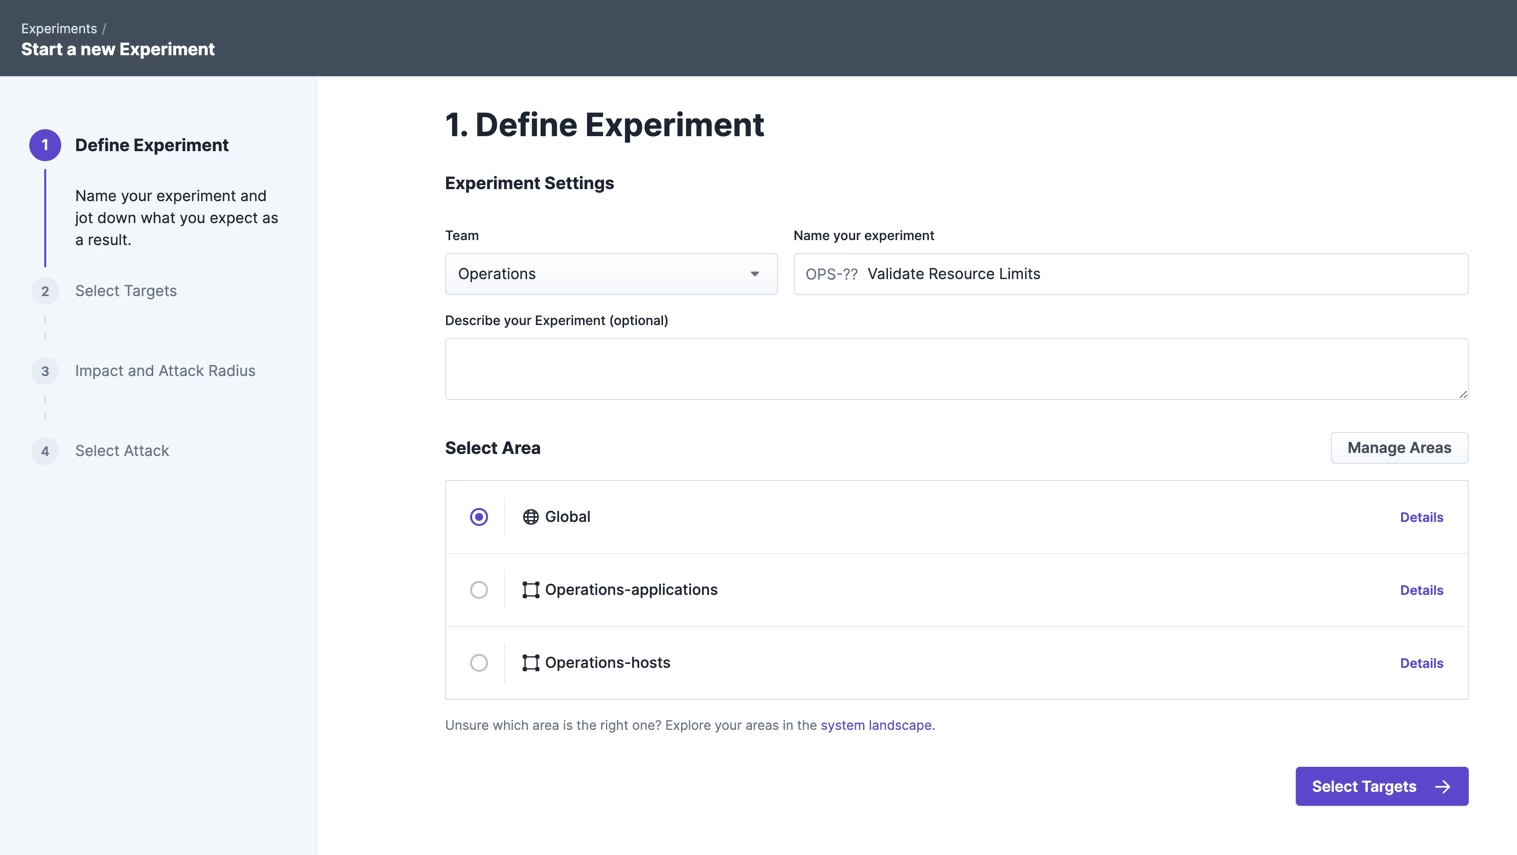
As a target we select the fashion-bestseller service, which currently has no defined resource limits:
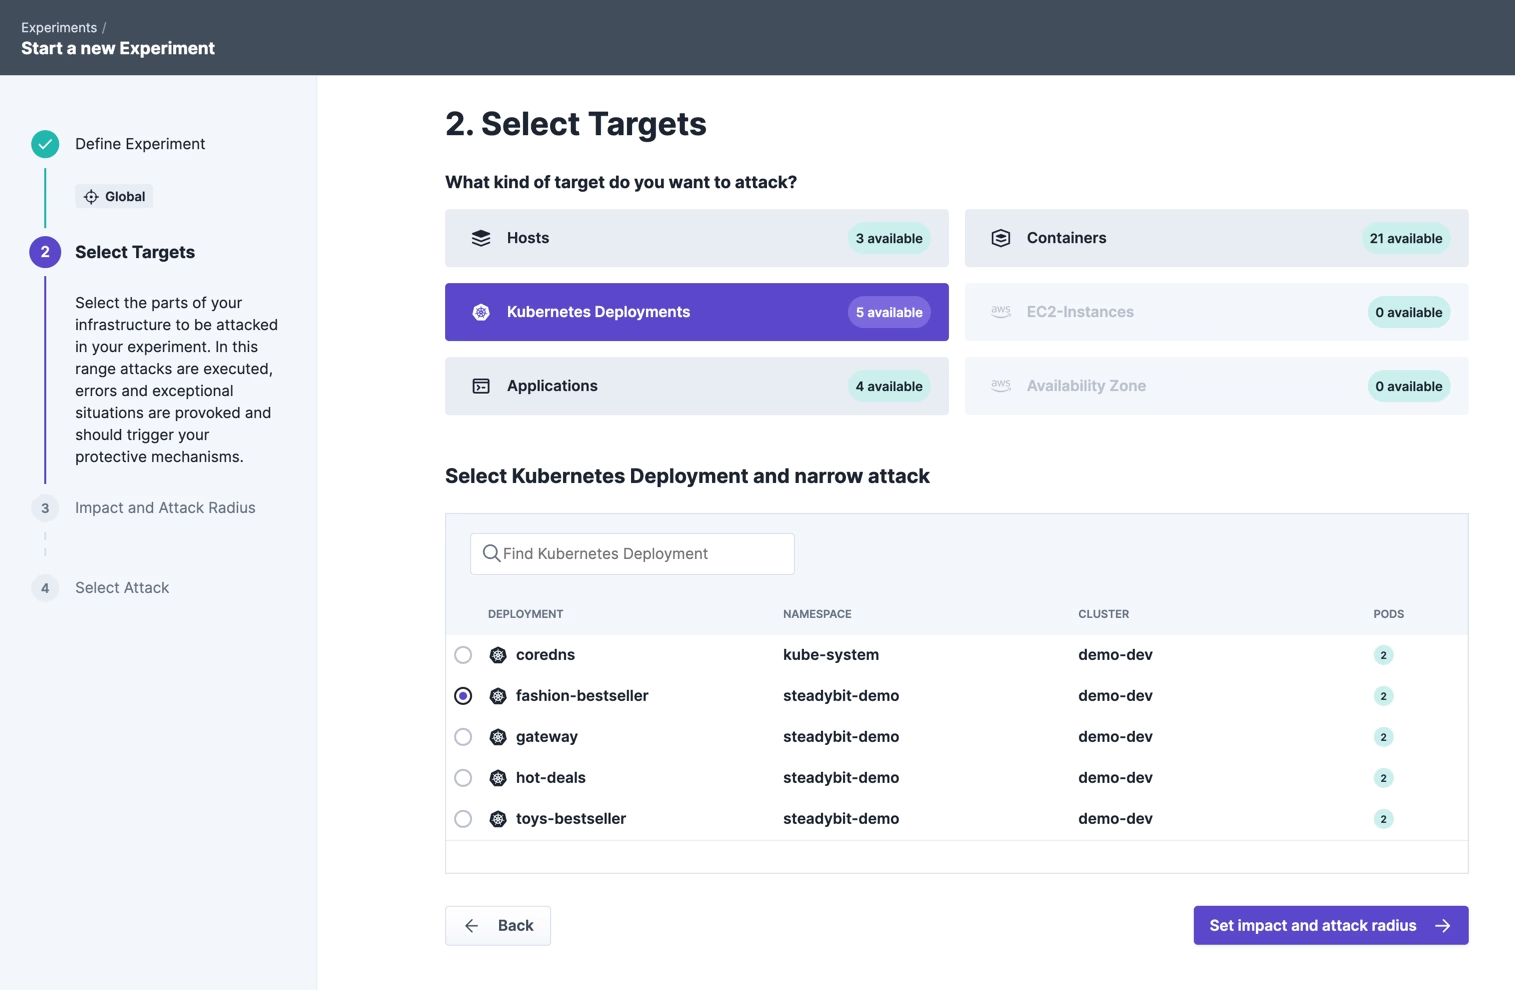
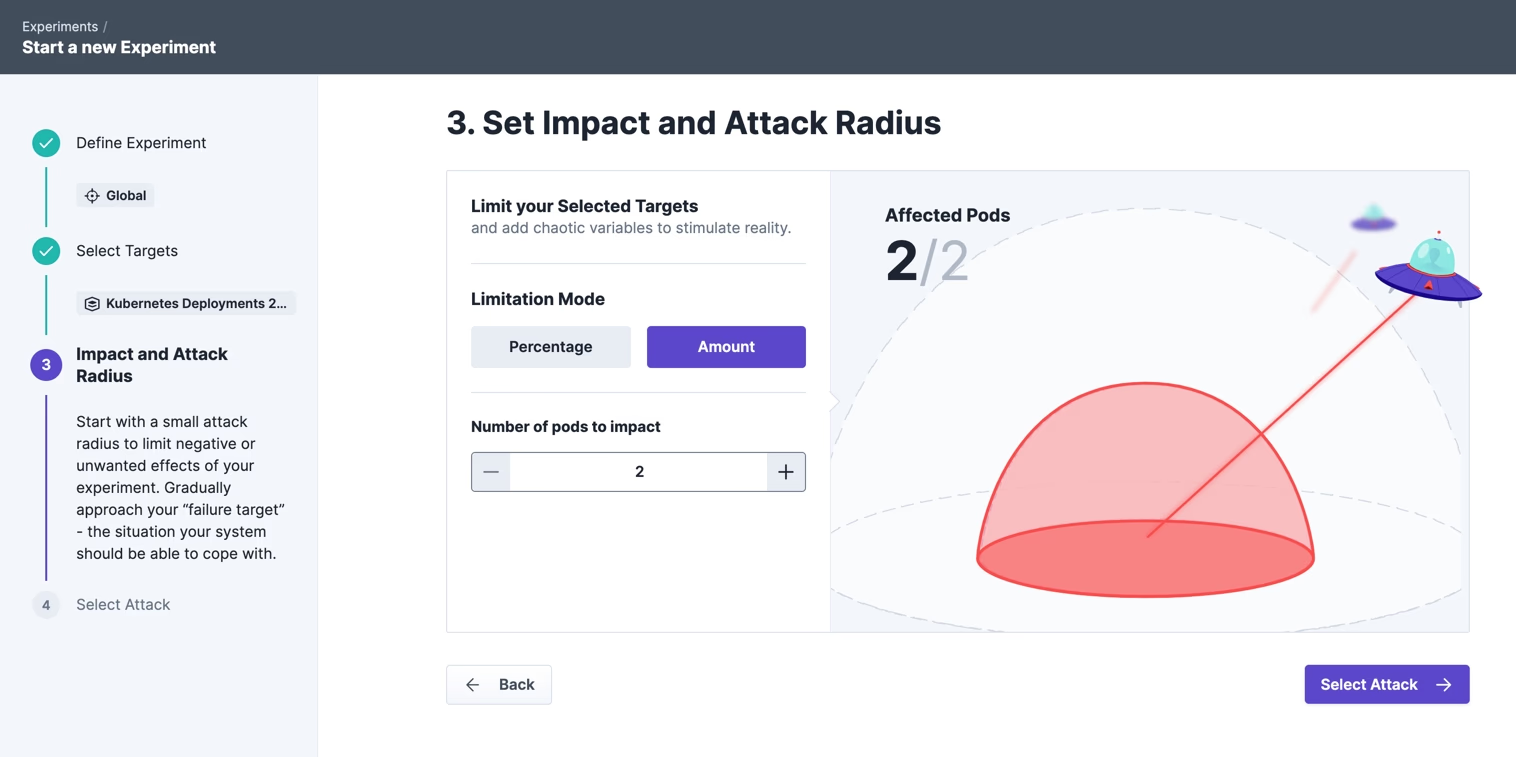
We select both pods as blast radius:
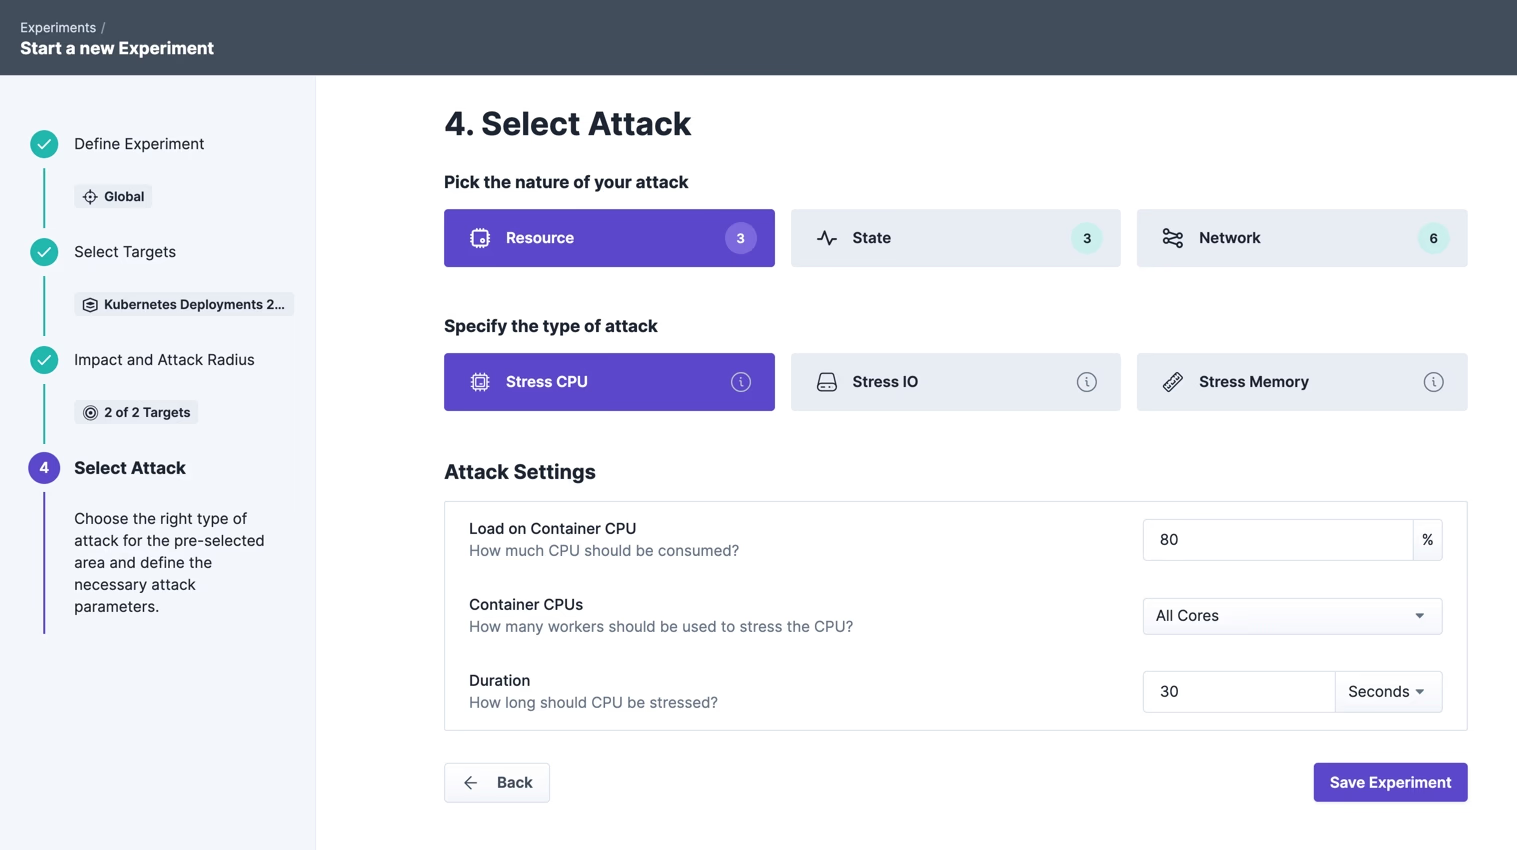
And let the CPU consumption increase to 80% for 30 seconds. We simulate a scenario here that often occurs in distributed systems, e.g. because faulty code was deployed with a code bug or similar which leads to an increased CPU consumption.
During the experiment, we observe the CPU usage of the fashion-bestseller pod with watch kubectl top pods -n steadybit-demo.
NAME                                CPU(cores)       MEMORY(bytes)
fashion-bestseller-fcdbf8776-dgq54  3072m            238Mi
gateway-684d55cd4b-55zk8            1m               321Mi
hot-deals-6b78f59ccc-2w5dw          2m               270Mi
toys-bestseller-79f56b469b-8tv8r    2m               254Mi
As expected, up to 3 CPUs are used by the pod during the experiment. In our demo scenario, of course, this does not have far-reaching effects, but in a productive environment, all other pods on the same node might also have problems if they have to perform CPU-intensive tasks at the same time.
Defining Resource Limits
In the next step, we want to check how the pod behaves when there is a defined resource limit. The following example shows the definition of CPU and memory limits in Kubernetes:
apiVersion: apps/v1
kind: Deployment
metadata:
    namespace: steadybit-demo
    labels:
        run: fashion-bestseller
    name: fashion-bestseller
spec:
    replicas: 1
    selector:
        matchLabels:
            run: fashion-bestseller-exposed
    template:
        metadata:
            labels: run: fashion-bestseller-exposed
        spec:
            serviceAccountName: steadybit-demo
            containers:
                - image: steadybit/bestseller-fashion
                    resources:
                        requests:
                            memory: "256Mi"
                            cpu: "250m"
                        limits:
                            memory: "2048Mi"
                            cpu: "750m"
                    imagePullPolicy: Always
                    name: fashion-bestseller
                    ports:
                        - containerPort: 8082
                            protocol: TCP
See here the full manifest. In this example, the container of the pod has a request of 0.25 CPU and 256 MiB of memory, and a limit of 0,75 CPU and 2048 MiB of memory.
Now let’s see if the set CPU limit really takes effect when we run the experiment again. The command watch kubectl top pods -n steadybit-demoshows that Kubernetes correctly limits CPU consumption:
NAME                                  CPU(cores)    MEMORY(bytes)
fashion-bestseller-6477f88986-vrstg   747m          217Mi
gateway-684d55cd4b-55zk8              2m            322Mi
hot-deals-6b78f59ccc-2w5dw            2m            268Mi
toys-bestseller-79f56b469b-8tv8r      2m            257Mi
Conclusion
The above experiment has shown that missing resource limits can lead to uncontrolled behavior and undesired side effects in a distributed system. It is therefore always recommended to define such limits. With the help of experiments, not only the presence and correct functionality should be checked, but also the continued correct functionality of the overall application while increased CPU consumption occurs.
Steadybit can not only help to perform these experiments, but also offers diagnostic functions in advance to detect missing resource limits at an early stage. The tool offers so-called state checks to continuously check if the overall system is still working. Contact us for a demo.

Get started today
Full access to the Steadybit Chaos Engineering platform.
Available as SaaS and On-Premises!
or sign up with

Book a Demo
Let us guide you through a personalized demo to kick-start your Chaos Engineering efforts and build more reliable systems for your business!