How to Measure Chaos Engineering

Have you ever asked yourself on how to measure the steady state of your system while doing Chaos Engineering. This blog post is a good starting point.
After we have asked ourselves whether it is worth investing in the topic of chaos engineering or resilience engineering, we now take a closer look at how the benefits of introducing that method can actually be measured.
But before you can answer this question more precisely, you have to look at how you can measure resilience in the first place. Because only if you know how resilient your system is and if the resilience ideally improves over time, you can also answer the question whether chaos engineering actually makes sense.
Basically, there are three areas for assessing the resilience of a system:
Static analysis of resilience mechanisms
Dynamic analysis of the system performance under disruptive events (typical chaos engineering practice)
Evaluation of metrics and thresholds (definition of critical services, determination of recovery time, definition of acceptable error rates)
The static analysis (1.) has a very low entry to identify areas where there is already potential for improvement without considering further runtime metrics.
However, the execution of chaos experiments (2.) should always be combined with the evaluation of metrics. After all, it only makes sense to inject disruptive events into a system if you know exactly how to recognize the steady state of a system and the correct behaviour of the respective business function under consideration.
The following question is central to this:
What Do Your Users Care About?
So that means basically, which business functions are most important to your customers and how do you measure that they are working correctly? These metrics are important to check whether the part of the application under test works for the customer or not. Based on these metrics, the so-called steady state can be defined. In User-facing systems they typically care about availability, latency, and throughput. See also the 4 Golden Signals described in the Google SRE Handbook.
To define the steady state, it is recommended to define S.M.A.R.T. goals:
- Specific: the steady state should clearly and explicitly state what it measures (e.g., measure availability by testing whether a request can be sent to the backend server).
- Measurable: the steady state (respectively the metric) should be something that can be calculated easily (e.g., “the latency of the service should be less than 100ms”, not “the service should respond quickly”).
- Achievable: you should be able to fulfill the steady state (e.g., if a service has an SLO of 95 percent, you cannot promise 100 percent).
- Realistic: your steady state definition should correspond to the user experience (e.g., an appropriate metric for a web server is response time, not CPU activity).
- Time-related: the steady state (respectively the metric) should cover a timeframe that is suitable for when your users operate your system (e.g., if your users only use your system between 9 AM to 5 PM, a 24-hour steady state will be counterproductive).
In particular, the “R” of the S.M.A.R.T goals is important here. This refers to the user experience. A CPU or memory metric, for example, fulfills almost all the requirements above, but it still says nothing about whether the user is restricted in using the application. A high CPU consumption, on the other hand, can lead to upscaling with the help of an automatic scaling mechanism, which is perfectly fine and correct.
From a technical point of view, the response time when interacting directly with the customer is more interesting. If the response time is poor, a lot of users will not use the service anymore and the revenue goes down.
Netflix goes one step further and uses business metrics to measure steady state. One good example is the number of clicks on the play button. Netflix recognizes whether everything is okay with the system based on the comparison with the historical data.
Failure Metrics
Once you have completed the above step and are in a position to recognize whether your system is in a healthy state or not, based on the defined metrics, you can move on with the next step. Take the findings from these metrics to a higher level to assess how resilient your system is.
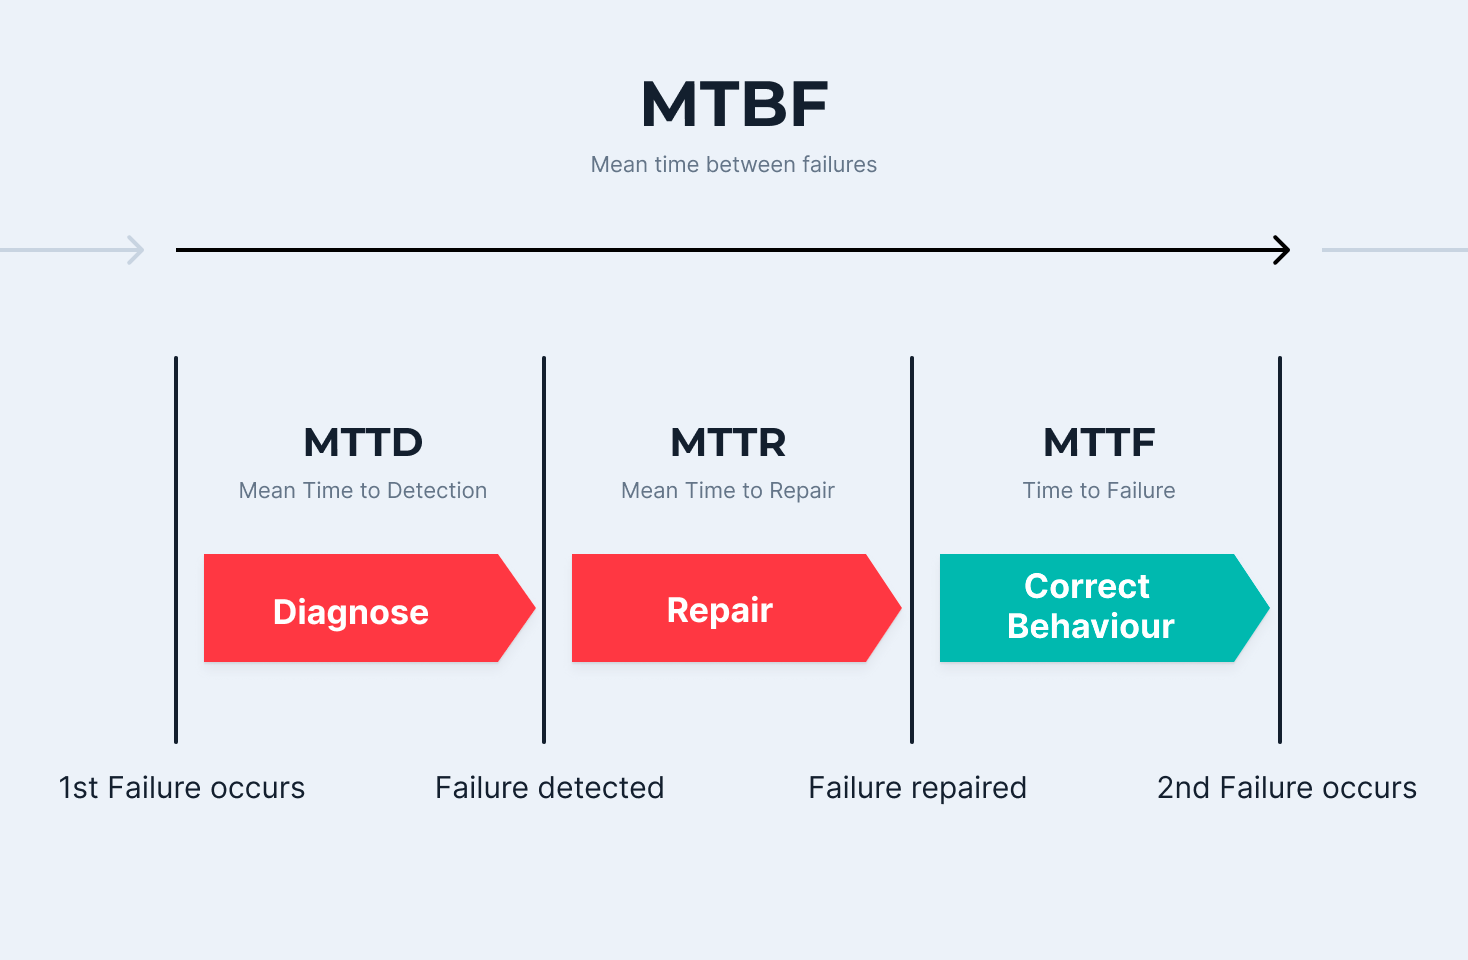
One possible way is to look at failure rates, and in particular Mean Time Between Failures (MTBF). This is the sum of Mean Time to Detection (MTTD), Mean Time to Repair (MTTR) and Mean Time to Failure (MTTF).
It is also important to mention here that people used to try to optimize the MTBF, i.e. avoiding outages, by using expensive high availability clusters or special appliances to make the monolithic system as highly available as possible. Today, the services are getting smaller and the number larger and thus complex distributed systems are created, where failures occur frequently. The goal here is to reduce the MTTR so that a faulty service is detected quickly and repaired in a very short time or the service can even heal itself if necessary. So in the end with the help of Chaos Engineering you are able to effectively reduce the MTTR and thus the availability and resilience of your services.

It is important that the term “Failure” is not misunderstood. The above definition of steady states specifies at which limit values of a metric an error exists. For example, this can also be a response time of greater than 200ms of a critical service. For this case the SRE terms SLIs (Service Level Indicator) and SLOs (Service Level Objective) are often used, which helps to connect metrics (SLI) to a service level SLO that represents quality of service in a given time window. We will dive deeper into that trending topic in another blog post.
Improve the resilience of your system
Ideally, you are now in a position to tell at any time whether the system is functional or not from the user’s point of view on the basis of the above-mentioned metrics. Even if this is not yet possible in a fully automated way, this is a good starting point for doing chaos and resilience engineering to see to what extent the system can handle anomalies and how long it takes until the system is healthy again.
We at steadybit want to go one step further. Our vision is that in the future steadybit will not only help to proactively test the resilience of the systems with the help of experiments, but it will almost evaluate the resilience automatically and proactively identify the areas in the system that still have weaknesses.

Get started today
Full access to the Steadybit Chaos Engineering platform.
Available as SaaS and On-Premises!
or sign up with

Book a Demo
Let us guide you through a personalized demo to kick-start your Chaos Engineering efforts and build more reliable systems for your business!