Harden Performance of REST calls using Spring WebFlux
Do you have sequential REST calls in your code? If so, how do they behave when the network is slow? Don’t know yet? Let’s learn together and cover how easy we can improve our code using Spring WebFlux when fetching data from multiple independent REST endpoints.
Our Example System
In order to make it hands-on we use a small demo online shop (checkout the GitHub repository) consisting of a Gateway-microservice which provides a REST endpoint (/products) to deliver various products to a shop-frontend. Since the Gateway is stateless it fetches all products directly from other microservices (Hot-Deals, Fashion, and Toys) synchronously (see code below).
@RestController
public class ProductsController {
    @Value("${rest.endpoint.hotdeals}")
    private String urlHotDeals;
    ...
    @GetMapping("/products")
    public Products getProducts() {
        Products products = new Products();
        products.setFashion(getProduct(urlFashion));
        products.setToys(getProduct(urlToys));
        products.setHotDeals(getProduct(urlHotDeals));
        return products;
    }

    private List<Product> getProduct(String url) {
        return restTemplate.exchange(url,
            HttpMethod.GET,
            null,
            productListTypeReference
            ).getBody()
    }
}
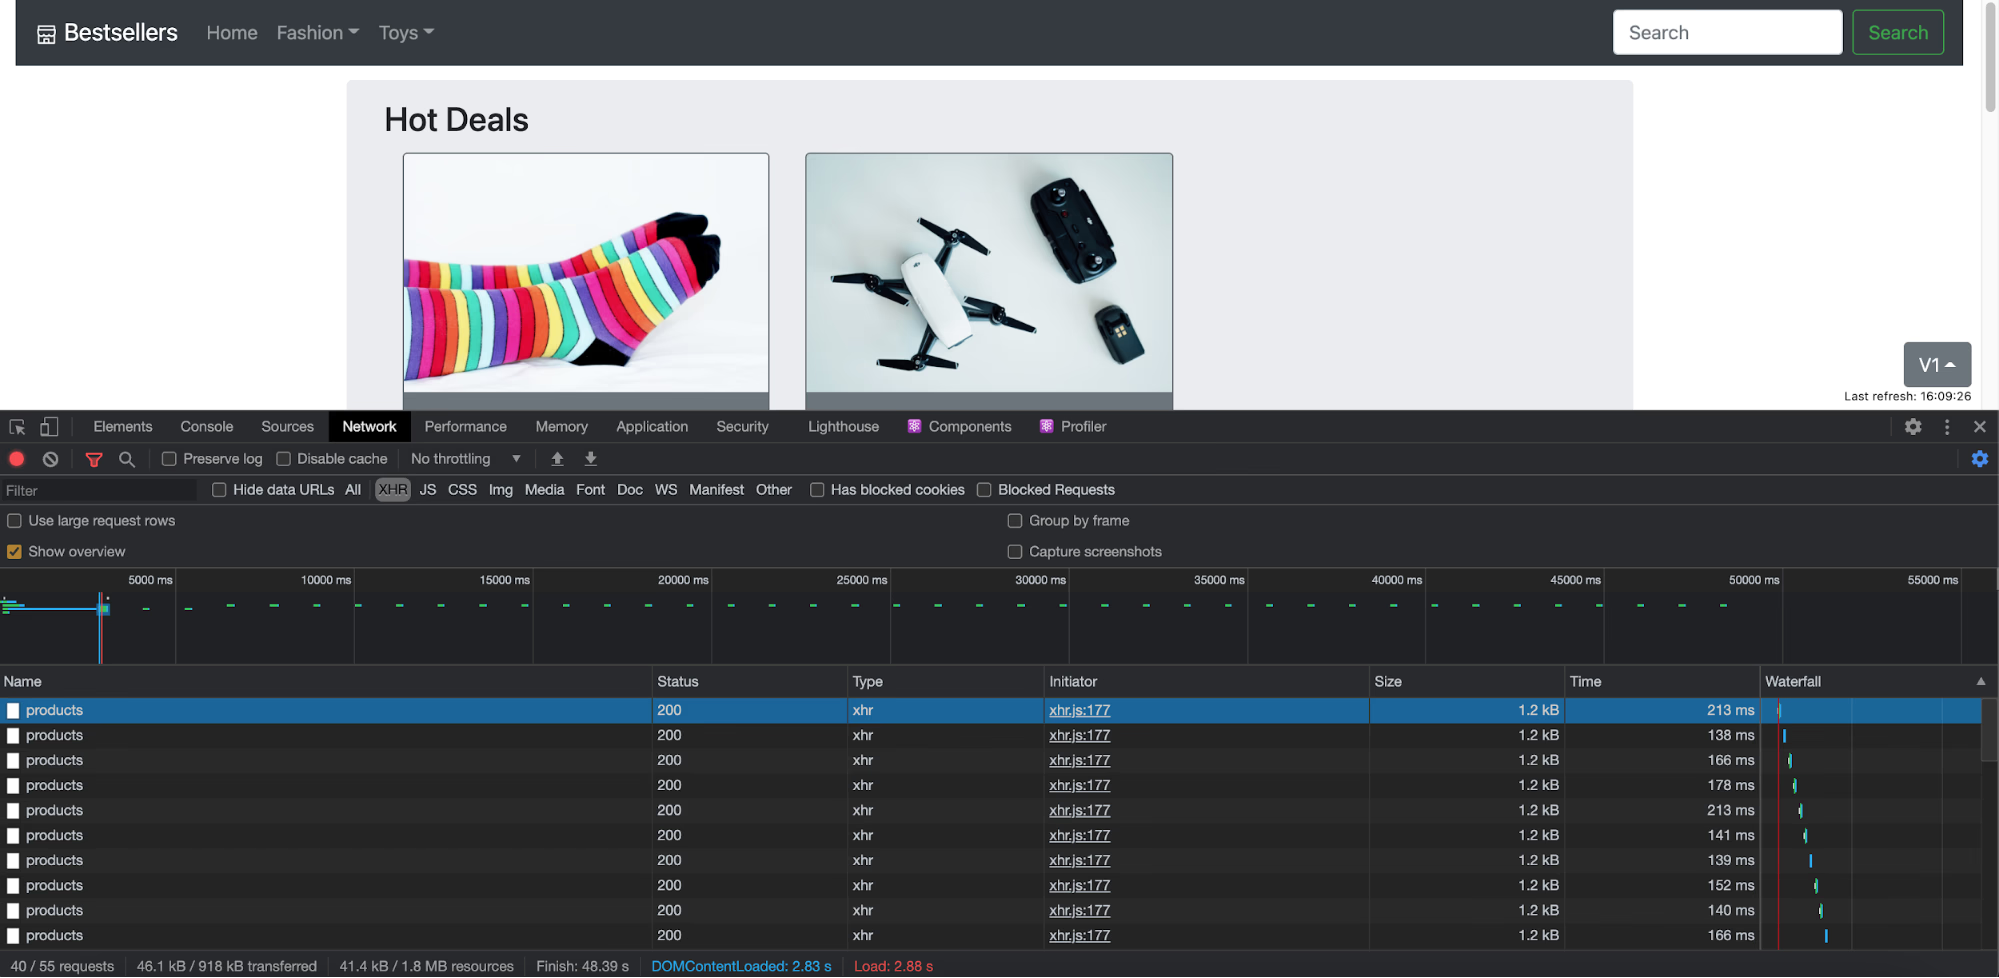
While this code works fine and delivers all the products to the frontend in a reasonable amount of time (~200ms), there is still some room for improvement under turbulent conditions.
What to improve?
So, what happens in turbulent conditions? Like the network is delayed, or one of the three microservices is not as fast as the others? Is the response still delivered in a reasonable amount of time? Usually, delaying the network is not as easy as it sounds. Especially in a non-local environment, it is hard to establish tooling for that, and it takes more time than the fixing part afterward. Luckily, we have Steadybit in place and can make use of it!
Steadybit for Rescue
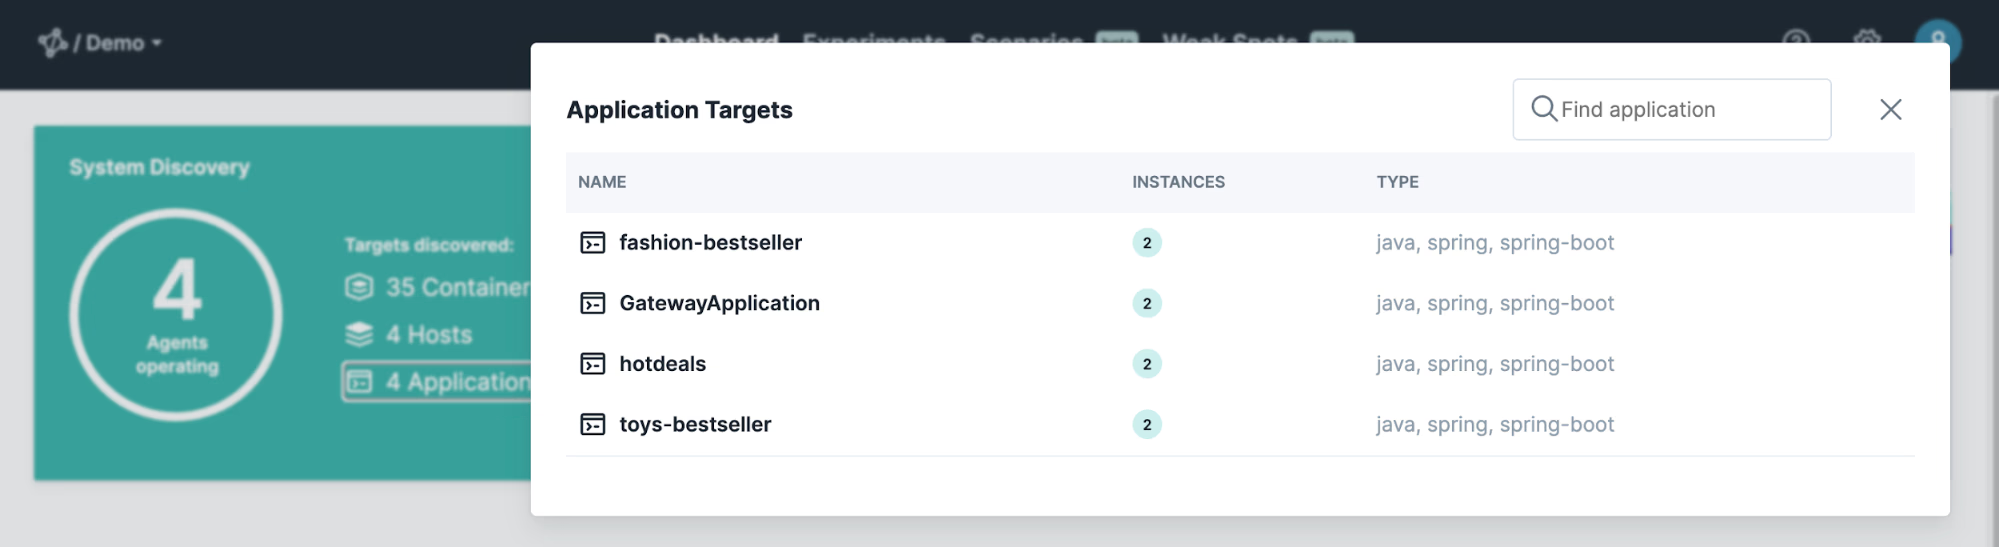
Opening up Steadybit, it has already discovered the entire system and is ready to run an experiment to simulate a turbulent condition. We’ll start with delaying the traffic for all three product-microservices (Hot-Deals, Fashion, and Toys) using the new experiment features introduced some weeks ago. Simply follow the next steps to create and execute the experiment. If you haven’t installed and configured Steadybit yet, let’s discuss how you can get it.
Step 1: Create an Experiment
The first thing to do is to create a new experiment, which is pretty straightforward:
- We go to Experiments, create a new Experiment, and choose the guided approach using our wizard.
- We give the experiment a useful name (e.g., “Shop is performant when having slow network”) and choose the Global area for now (giving access to the entire environment).
- We choose to attack containers and specify them using attributes. We use a query like the one below to target all three product microservices (hot-deals, fashion-bestseller, and toys-bestseller).
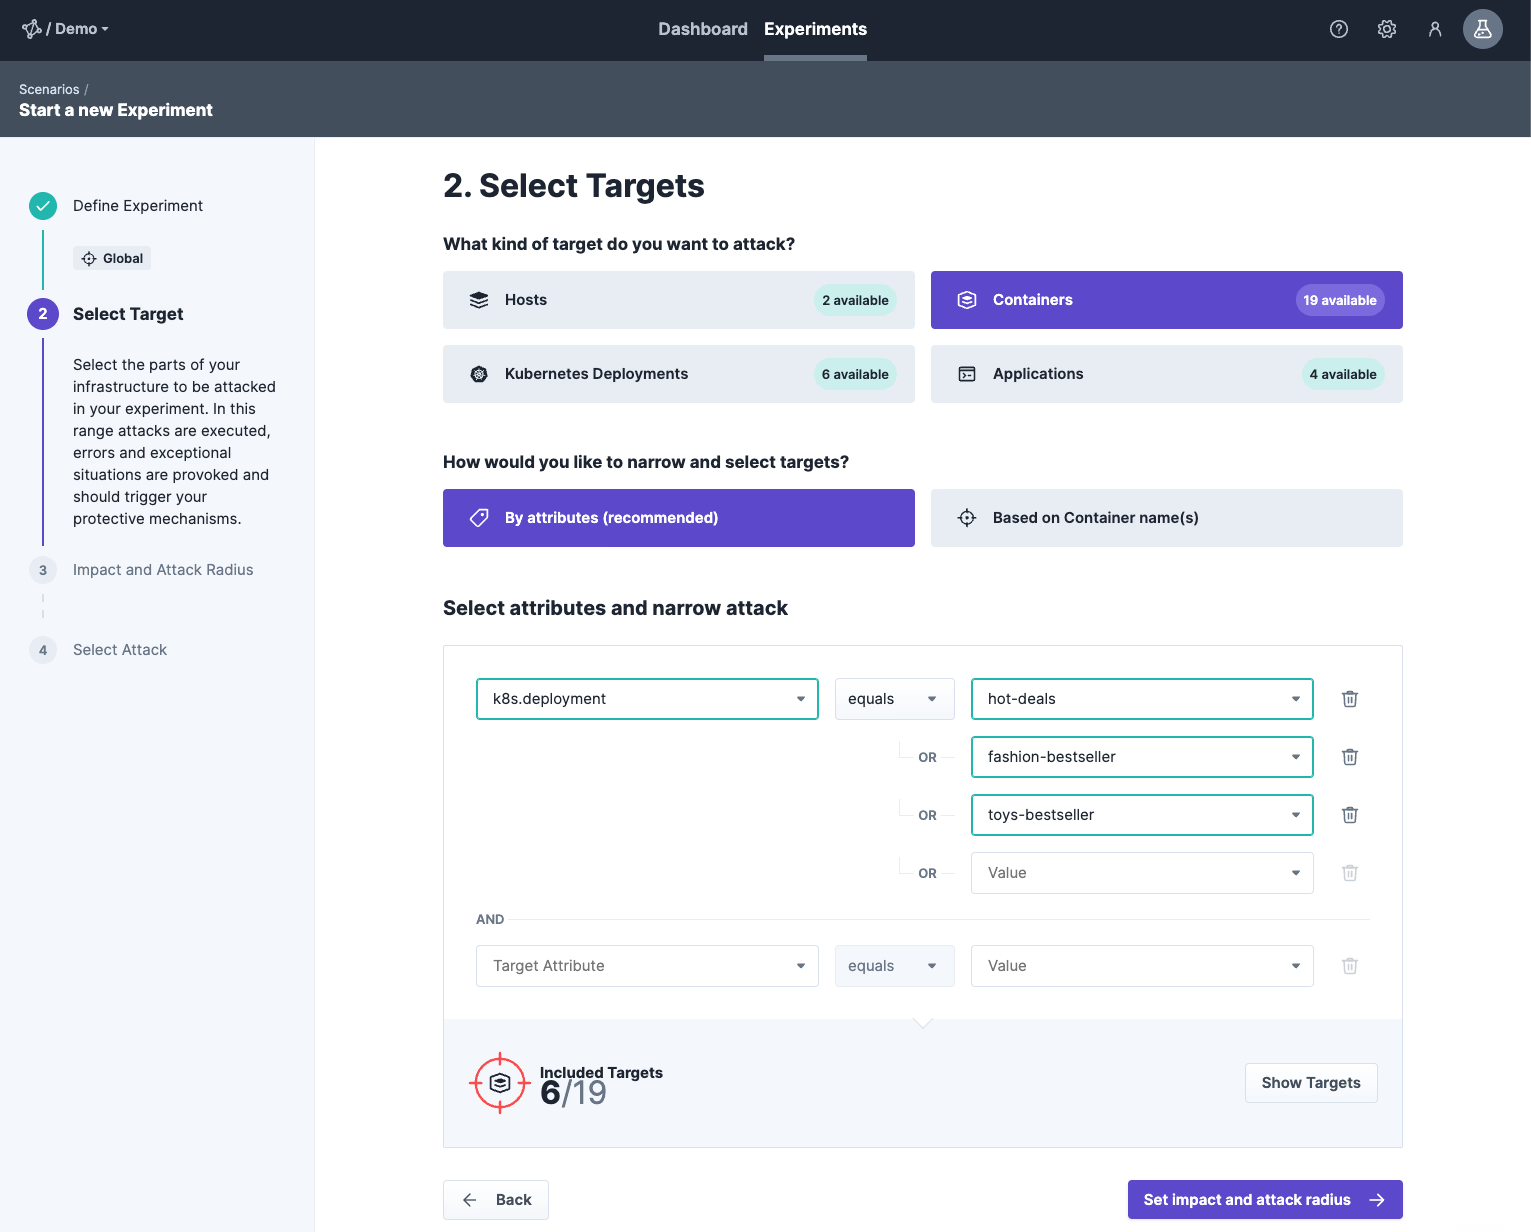
- Since we want to have a maximum effect, we choose to have an impact of 100% at the following wizard step.
- Apply the attack from the category Network, Delay Traffic, and start with default settings (having 500ms delay). We also disabled the Jitter in the Additional Settings‘ which would add some randomness to represent the real world. Complete the wizard via Save Experiment.
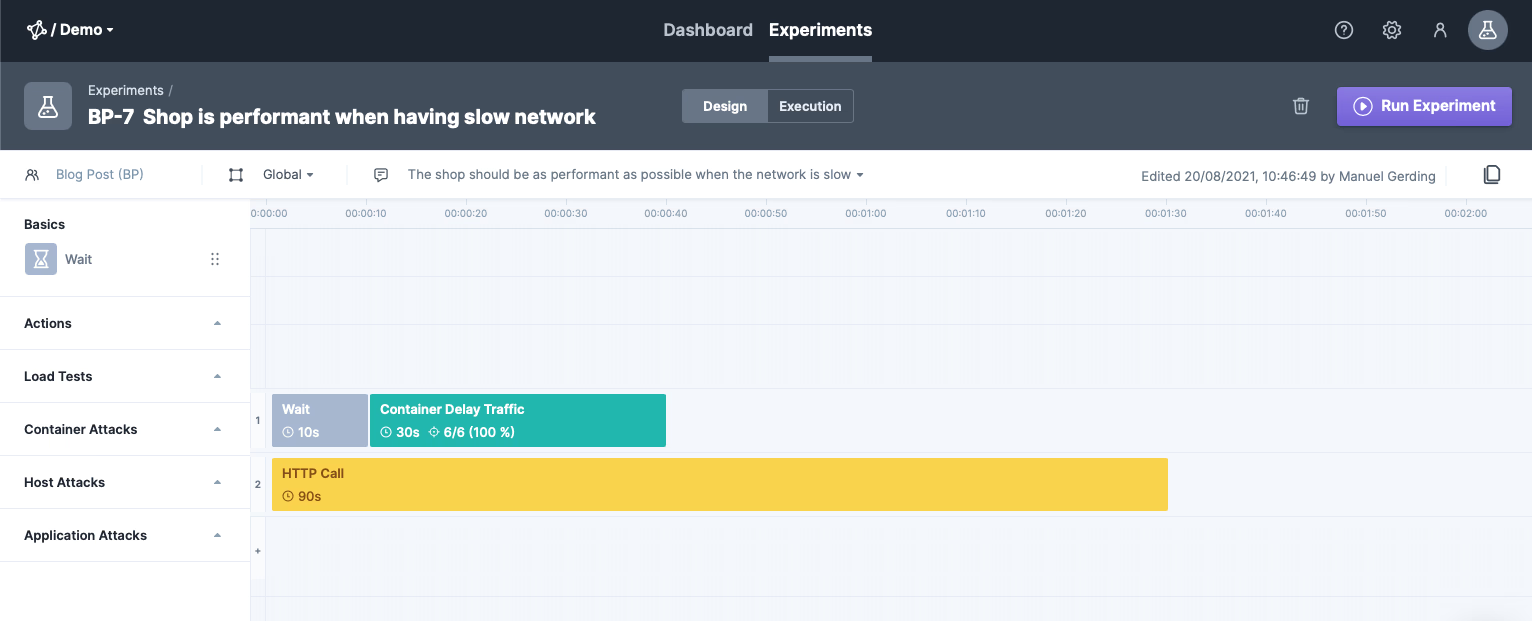
Step 2: Extending Experiment
Although the experiment is ready to be executed, we will tune it to measure the HTTP response time while experimenting. Therefore, we add a wait step before the Delay Traffic-attack of 10 seconds (our reference response time) and an HTTP call for the /products endpoint over 90 seconds in the second lane.
Step 3: Run the Experiment
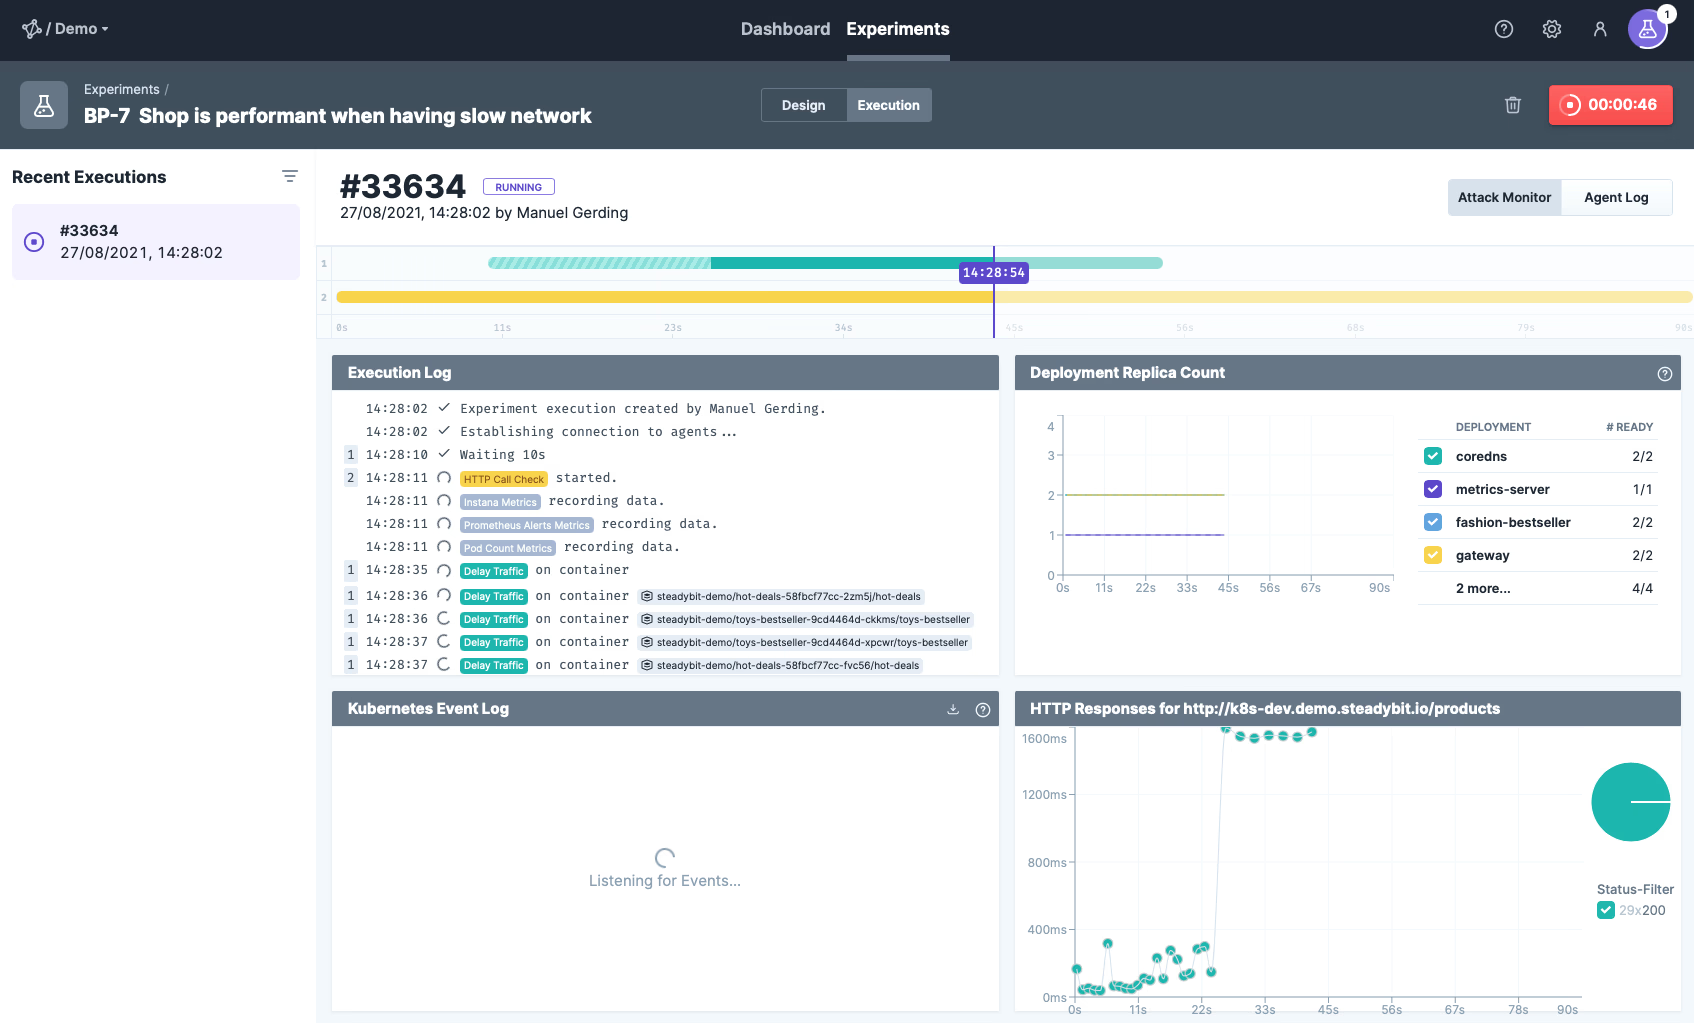
Now it’s time to take action and run the experiment. Thanks to the new experiment features, we can see all relevant parts directly in Steadybit’s execution window. We can check the response time using our HTTP responses. Furthermore, by looking at the Deployment Replica Count and Kubernetes events, we can be sure that Kubernetes does not restart PODs due to failed Liveness probes.
Uff, what an effect. Although the network is only delayed by 500ms, it is summed up in total to a response time of up to 2000 ms. Compared with the values before and after the delay network attack (~30ms) the response time has increased by more than 60 times.
Step 3: Integrate WebFlux
The cause of this behavior is that the Gateway fetches all three product endpoints sequentially after each other. It doesn’t start to request, e.g., products of toys before fashion has responded (see code above, method getProducts()).
To solve that, we can parallelize all three requests as they have no dependencies on each other. The easiest way to do that is to integrate Spring WebFlux. Spring WebFlux supports reactive programming in Web applications based on Project Reactor’s Flux and Mono.
So, first, we add the dependency to the Gateway’s pom.xml.
<dependencies>
    <dependencies>
        <dependency>
            <groupId>org.springframework.boot</groupId>
            <artifactId>spring-boot-starter-webflux</artifactId>
        </dependency>
    </dependencies>
</dependencies>
After that, we can refactor the Gateway’s REST Endpoint inProductsControllerby using theWebClientimplementation based on Mono instead of Spring’s RestTemplate. TheWebClientis a non-blocking asynchronous REST client so that all three requests are triggered in parallel – independent of the response time of one microservice.
@RestController
public class ProductsController {
    private final WebClient webClient;

    @GetMapping("/products")
    public Mono<Products> getProducts() {
        Mono<List<Product>> hotdeals = getProduct("/products/hotdeals");
        Mono<List<Product>> fashion = getProduct("/products/fashion");
        Mono<List<Product>> toys = getProduct("/products/toys");
        return Mono.zip(hotdeals, fashion, toys)
            .flatMap(transformer -> Mono.just(new Products(transformer.getT1(), transformer.getT2(), transformer.getT3())));
    }
    private Mono<List<Product>> getProduct(String uri) {
        return webClient.get().uri(uri)
            .retrieve()
            .bodyToFlux(productTypeReference)
            .collectList()
            .flatMap(Mono::just)
            .doOnError(throwable -> log.error("Error occured", throwable));
    }
}
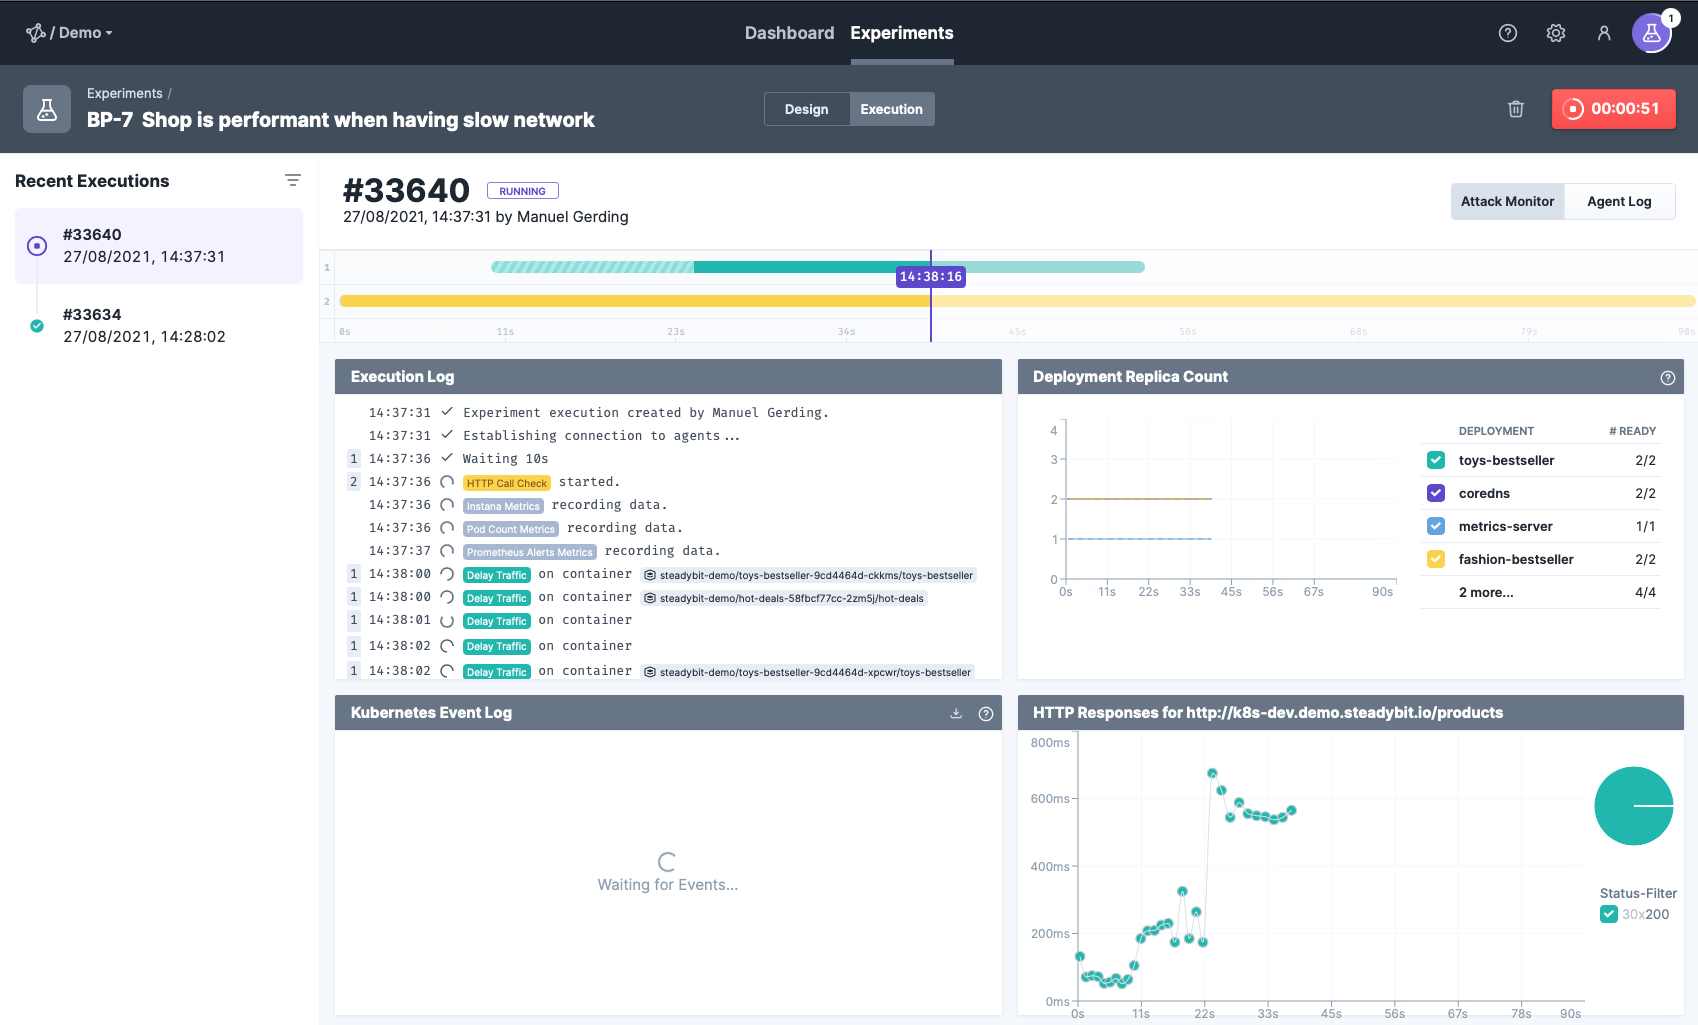
Step 4: Validate Change
Let’s validate our new implementation in Steadybit again by re-running the same experiment and checking the response time: Now the response time is roughly 550ms – 600ms which is reasonable as it is exactly the sum of the induced delay of 500ms plus the response time in good conditions (~50ms – 100ms). So, pretty good performance tweak!
Conclusion
In this blog post, we have learned how to speed up the implementation of an orchestration endpoint using Spring WebFlux Mono. Thanks to the new experiment features of Steadybit, we could also easily validate the difference of the two implementations.
However, don’t forget to check the new WebFlux-based implementation for newly introduced weak spots. Start by validating the exception handling, then check how the WebFlux client reacts to the unavailability of one of the REST endpoints (e.g. via a simulated AWS zone outage). Of course, these need to be re-validated whenever relevant code changes happen.

Get started today
Full access to the Steadybit Chaos Engineering platform.
Available as SaaS and On-Premises!
or sign up with

Book a Demo
Let us guide you through a personalized demo to kick-start your Chaos Engineering efforts and build more reliable systems for your business!