Bring AppDynamics Health Rules into Your Steadybit Chaos Experiments
We’re excited to announce that we’ve added a new observability integration to the Steadybit ecosystem: AppDynamics.
AppDynamics is an application performance monitoring tool that offers full-stack observability and was acquired by Cisco in 2017.
With this new integration, teams now have an easy way to see the exact performance impact of their experiments and validate that their monitoring is configured accurately.
So what does this mean for Steadybit users?
Automatically validate AppDynamics health rules
When you install the AppDynamics extension, Steadybit automatically will discover your applications and health rules. You can include those health rules directly in your experiments to check whether your applications stay in a healthy state or if any rules are violated during a fault injection.
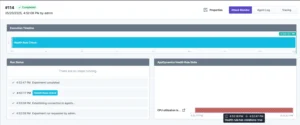
For example, you can get started with this type of experiment using this experiment template, which allows you to test if AppDynamics is correctly detecting a crashloop error. If you run this experiment and AppDynamics does not detect the issue as you expect, you know you need to make improvements to your monitoring configuration so you don’t miss these events in production.
Manually recreate past incidents as experiments
When incidents occur, you can view the full logs in AppDynamics to see exactly what happened. After you’ve mitigated the damage and found the root cause, there’s another step that you can take with Steadybit.
By building experiments that mimic the conditions of past incidents, you can use these experiments as regression tests to simulate the same failure scenarios and validate that monitoring is catching the issue and any reliability improvements are active and successful.
Send experiment events into AppDynamics
Every experiment you run in Steadybit sends contextual event data back into AppDynamics. This means your observability dashboard includes when experiments were run and what they affected. Having that context helps you better understand system behavior over time and makes it easier to correlate failures and alerts.
As you run experiments that push your systems to the limits, you can refine your health rules to detect and remediate issues before they reach their breaking point.
Use Steadybit Experiments as a Quality Gate on New Releases
If at a certain point in time you have a perfect observability configuration and well-thought out experiments, that doesn’t guarantee that you’ll maintain this posture as your systems change.
With every new release, your observability coverage and reliability requirements could slip a little without any guardrails in place.
By automating Steadybit experiments and running them as part of your CI/CD process, you can ensure that your observability and reliability standards are continually prioritized.
This leads to fewer surprises, more resilient releases, and stronger on-call readiness.
Start using the AppDynamics extension
You’ll find the AppDynamics extension in the Reliability Hub, and you can find installation instructions in the GitHub repository.
Once you’ve installed the AppDynamics extension, you can start running your first integrated experiment in minutes and start improving your system resilience.
If you want to learn more about how this or any other integration works with Steadybit, get started by scheduling a demo with our team so we can show you the platform and answer any questions.

Get started today
Full access to the Steadybit Chaos Engineering platform.
Available as SaaS and On-Premises!
or sign up with

Book a Demo
Let us guide you through a personalized demo to kick-start your Chaos Engineering efforts and build more reliable systems for your business!