Validate Risks with Experiments
Create and run experiments that provide real insights on your systems
Put your systems to the test and improve your operational readiness with a wide variety of experiments. Identify all of your reliability gaps and system limitations.
- Simulate network-level outages, latency, and traffic issues
- Run actions to stress resources like CPU, disk space, and memory
- Change instance states and test database failover processes
- Inject application-level faults with delays and method exceptions

See Recommendations
Our Advice feature provides you with a list of recommended experiments
Start with Experiment Templates
Create new experiments fast by selecting from over 50 pre-built templates

Create Custom Actions
Build experiments from scratch and add your own custom faults
Lowering the chaos engineering learning curve
When it’s easy to build experiments, reliability can be an inclusive cross-team effort.
Learn how to create reliability tests quickly with the Steadybit experiment editor.e exact experiment you want in minutes.
Read MoreBuild new experiments fast with hundreds of no-code actions.
Read MoreUse a library of 80+ templates to generate and review ready-to-run experiments.
Read MoreWatch experiments run in real-time to see how each step impacts your system.
Read MoreRun future experiments as one-offs or recurring tests.
Read MoreCreate automated workflows with the Steadybit API, CLI, and MCP Server.
Read More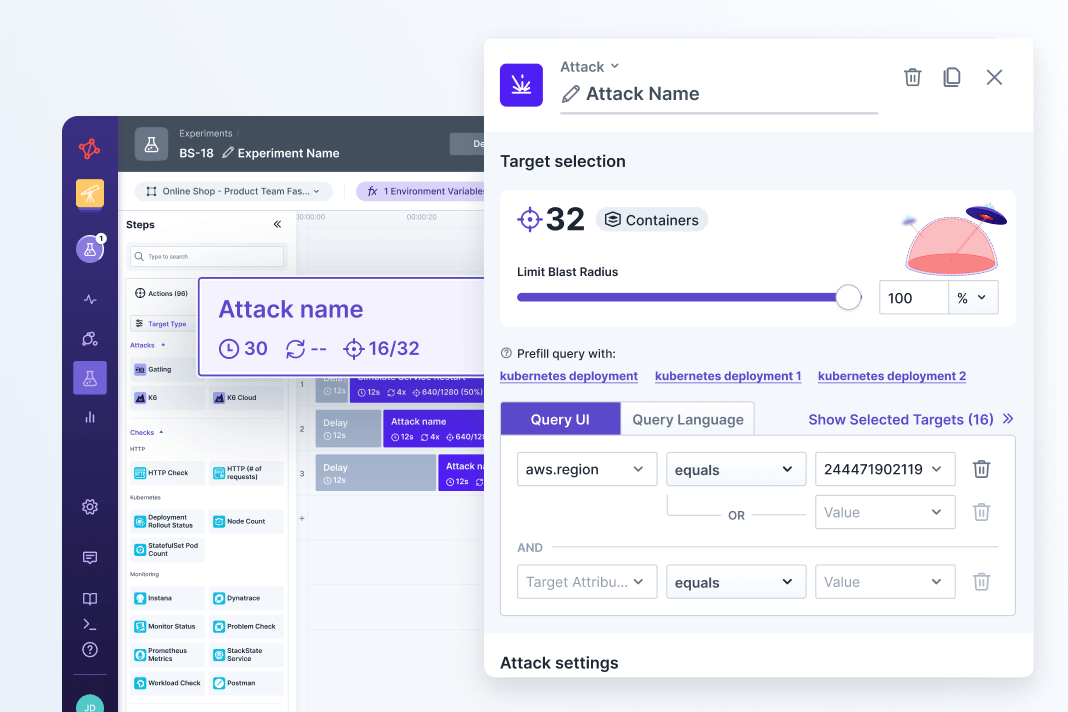
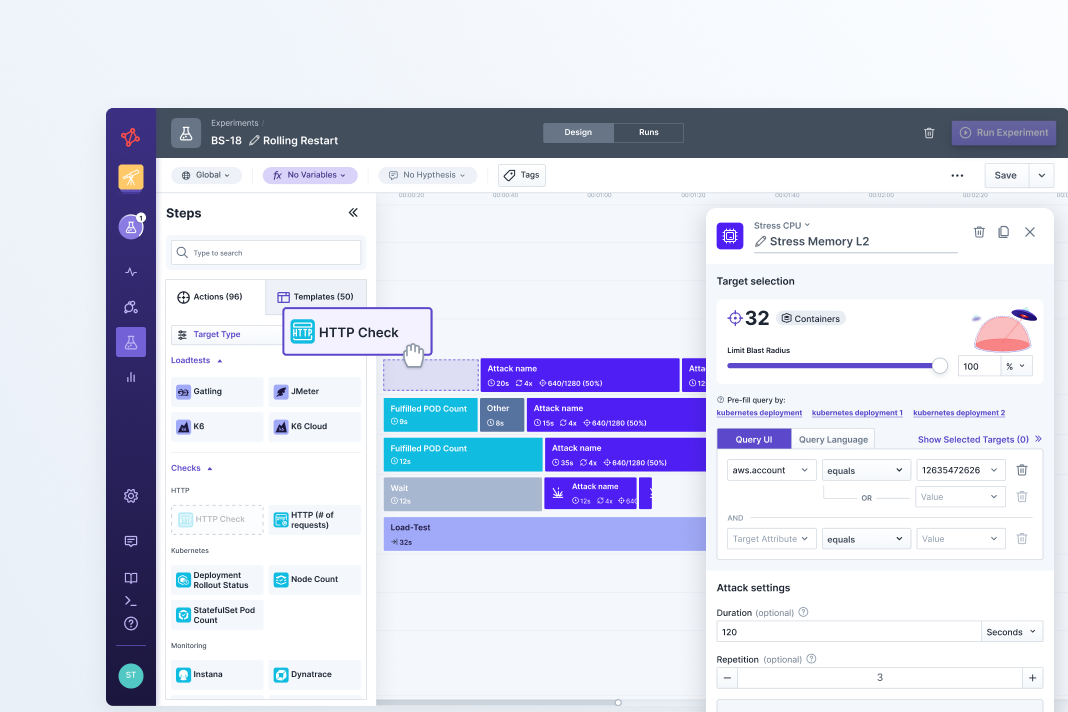
Define targets with granular precision and set a safe blast radius
It’s important to start with a small blast radius when running experiments for the first time. For example, you may target only 10% of the pods in a cluster with a given attack. As you build confidence in how your system will respond, you can expand your blast radius and take on more risk.
Targeting in Steadybit uses an intuitive query language based on discovered metadata. It’s easy to be specific and safe, so you know exactly what your experiment will impact. Each action has a blast radius you can adjust with a simple toggle control. There is always an emergency stop button close by to hit the brakes and rollback changes.
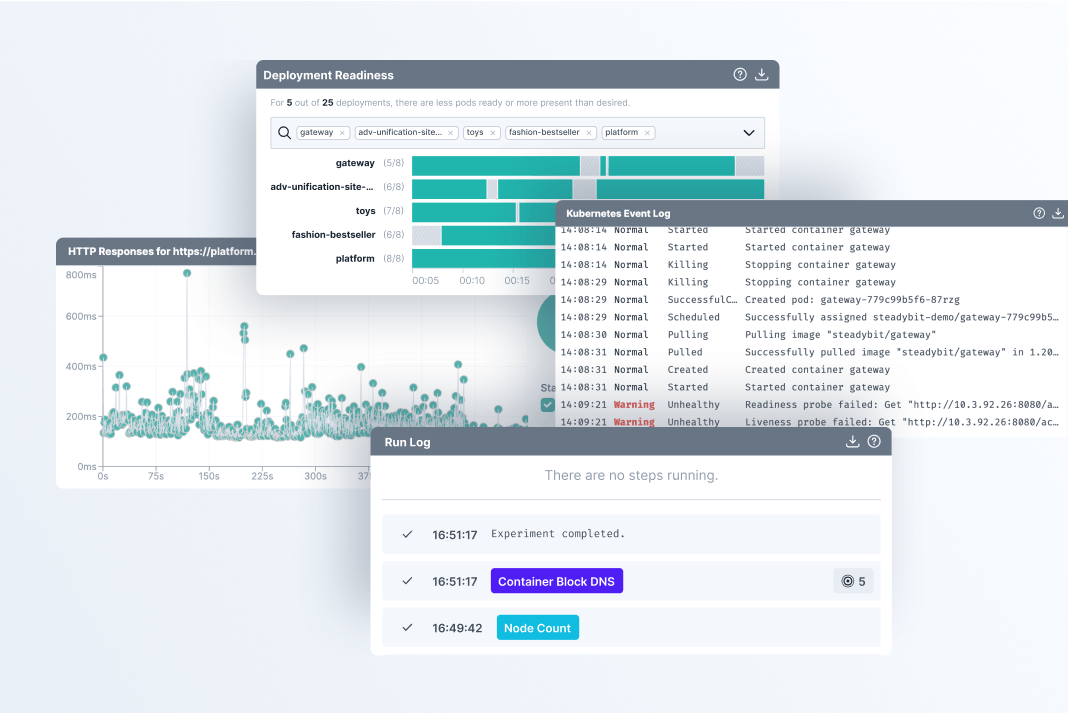
Watch experiments run in real-time and validate monitoring alerts
When you start an experiment, you will be able to watch it run in real-time as each step is executed and review a summary of your system’s behavior. If your target is a Kubernetes cluster for example, you’ll see the Kubernetes event log so you can see each change and the results of health checks.
You can also watch to see if your observability tool is raising an alert when expected. Just install the relevant extension and view these real-time events in Steadybit.
Use a library of 200+ open source actions & templates
Create reliability tests across your tech stack with a wide range of pre-built actions and templates. View the full library in the Reliability Hub.
Actions
Templates
Stress CPU
Test your application's resilience to high CPU load by generating load for one or more cores.Stress IO
Generate read/write operations on hard disks or ephemeral storage for a given duration.Stress Memory
Stress a specific amount of memory using ongoing memory allocations, reads and writes.Trigger Shutdown Host
This action triggers a reboot or shutdown of the host to validate failover processes and impact.Fill Disk
This action fills the container's ephemeral storage with random data for a given duration.Time Travel
Test your application's ability to handle time changes by changing the clock time.Change CPU Frequency
Dynamically adjust the CPU frequency limits across all cores for a specified duration.Delete Pod
This attack allows you to delete one or multiple pods to test the resilience of your application.Cause Crash Loop
This action continuously kills specified containers in a selected pod.Rollout Restart Deployment
Simulate the rollout of a Kubernetes deployment using a kubectl command.Pause Docker Container
Run this action to pause one or more containers for a certain amount of time.Taint a Node
Use this attack to taint one or multiple nodes for a given duration.Drain Node
Use this attack to drain one or multiple nodes and check performance degradation.Stop Container
Check the exit behavior and restart process by terminating one or more containers.Blackhole Subnet Attack
This action lets you simulate an outage by assigning a network ACL to a selected subnet.Blackhole Zone Attack
Simulate an outage of an entire availability zone to see whether traffic is rerouted correctly.Corrupt Outgoing Packages
Inject corrupt packets by introducing single bit error at a random offset into egress traffic.Drop Outgoing Traffic
This action causes packet loss for outgoing network traff (egress).Block DNS
This network attack blocks access to DNS servers for a specific duration.Block Traffic
This action drops all traffic to specified hostnames, IP addresses, and ports.Delay Outgoing Traffic
Use this action to inject latency into egress network traffic for a certain duration.Change Azure VM State
This action allows you to reboot, delete, stop or deallocate Azure virtual machines.Change EC2 Instance State
Reboot, stop, hibernate and terminate EC2 instances during an experiment.Change GCP VM State
Reset, delete, stop or suspend GCP virtual machines during an experiment.Run AWS FIS Experiment
Execute AWS FIS Experiments via Steadybit to manage everything in one place.Trigger DB Instance Stop
Test disaster recovery processes by stopping RDS database instances.Reboot RDS Instances
This action enables you to reboot a single RDS database instance.Trigger DB Cluster Failover
This action triggers DB cluster failover by promoting a standby instance to primary.Inject Latency
Use this action to inject latency into AWS Lambda or Azure functions.Inject Exception
This action injects exceptions into applications for a set amount of time.Inject Status Code
Inject a fixed status code to test how upstream services respond to specific HTTP statuses.Inject Controller Exception
Inject a RuntimeException into a Spring™ MVC controller before the handler method is executed.Inject Java Method Exception
Inject a RuntimeException into a public Java method for a given amount of time.Java Method Delay
Run this attack to inject latency into any Java-based application for a given duration.Fill Diskspace
This action fills the temporary disk space of on AWS Lambda or Azure function.Create Maintenance Window
Create a maintenance window to avoid false positives in your monitoring system.Check Monitor Status
This action collects information about a specified monitor and verifies an expected status.Create Monitor Downtime
Mute Datadog monitors during experiments to not create unnecessary noise.Check Grafana Alert Rule State
Collect information about the state of the Grafana alert rules during an experiment.Gather Prometheus Metrics
Collect Prometheus metrics during an experiment to help validate your hypothesis.Check SLO State in Splunk
Collect information on the SLO state in Splunk so you can check application performance.Create Muting Rule in New Relic
Mute alerts for a specified amount of time so experiments don't create extra noise.Run a K6 Load Test
Use this action to integrate the execution of K6 load tests directly into your experiments.Run a JMeter Load Test
Run your existing JMeter load tests as steps within experiments in Steadybit.Run a Gatling Load Test
Run your existing Gatling load tests as added steps in your chaos experiments.
HTTP Checks
Check HTTP responses during experiments to monitor system health at a given time.Istio gRPC Abort
Injects a gRPC abort fault into all gRPC routes of the targeted virtual services.Kong Route Terminate Requests
Using the Kong request termination plugin to cause abnormal behavior.Limit IO Threads
Limit the number of IO threads per Kafka broker for a set duration.Check Queue Backlog
With this action, Steadybit can check the state of a consumer for a given time.Run Jenkins Job
Use this action to run a Jenkins Build job as part of your Steadybit Experiment.Explore More Actions
Browse open source actions that you can easily add to experiments.
Check Kafka Consumer's Reaction to Record Loss
Deny access to the topic for consumers and delete records during this time.Dynatrace Should Detect a Crash Looping as Problem
Verify that Dynatrace alerts you on pods not being ready to accept traffic.Increase Latency Progressively for a Linux Host
Latency of a Host progressively increases to analyse at which point the communication breaks.Check if Load Balancer Covers an AWS Zone Outage
Ensure that failover works seamlessly by simulating Zone outages.Test if Kubernetes Deployment Survives Redis Latency
Verify that your application handles an increased latency in a Redis cache properly.Stress CPU of Kubernetes Deployment
Stress the CPU of a subset of or entire Kubernetes deployment for an amount of time.Test Scaling Up of ECS Service Within Given Time
Ensure that you can scale up your ECS service within a reasonable time.Third-Party Service Becomes Unavailable for Kubernetes
See the effect of an unavailable 3rd-party service on your deployment's success metrics.Test Graceful Degradation of Kubernetes Deployment While RabbitMQ Suffers High Latency
Test how your application handles high latency.Ensure Reasonable Recovery Time When Losing a Pod
Kubernetes should bring up a new pod to ensure system stability when a pod is deleted.Check that Prometheus Detects Unhealthy Deployments
Verify that Prometheus metrics catch unready pods in a Kubernetes deployment.Test if Windows Host Reboot Is Alerted by Datadog
Testing if Datadog raises an alert when a Windows host is suddenly missing.Draining a Node Should Reschedule Pods Quickly
When draining a node, Kubernetes should reschedule running pods on other nodes.Check Faultless Redundancy During Rolling Update
Checks performance impacts of degradation during a rolling update.New Relic Detects an Incident for CPU Spikes in an ECS Task
Validate your observability alerts for detecting a CPU spike in your AWS ECS clusterGraceful Degradation when Microsoft SQL Server Database Can Not Be Reached
Ensure your system indicates an appropriate error message.Check if Datadog Detects Lost Windows Host Connection
Check that Datadog detects when a Windows host suddenly loses connection.Check Certificate TLS/SSL Expiry for Linux Hosts
Turn time forward and check whether your TLS/SSL certificates are valid.Test if Kubernetes Deployment Survives Redis Downtime
Check that your application gracefully handles a Redis cache downtime.Explore More Templates
Browse the full list of open source experiment templates in the Reliability Hub.

Missing an action that would unlock a useful experiment?
Our open source extension framework makes it easy to add custom components to Steadybit. Build your own custom actions using our language-agnostic ActionKit and create any experiment that would be useful for your organization.
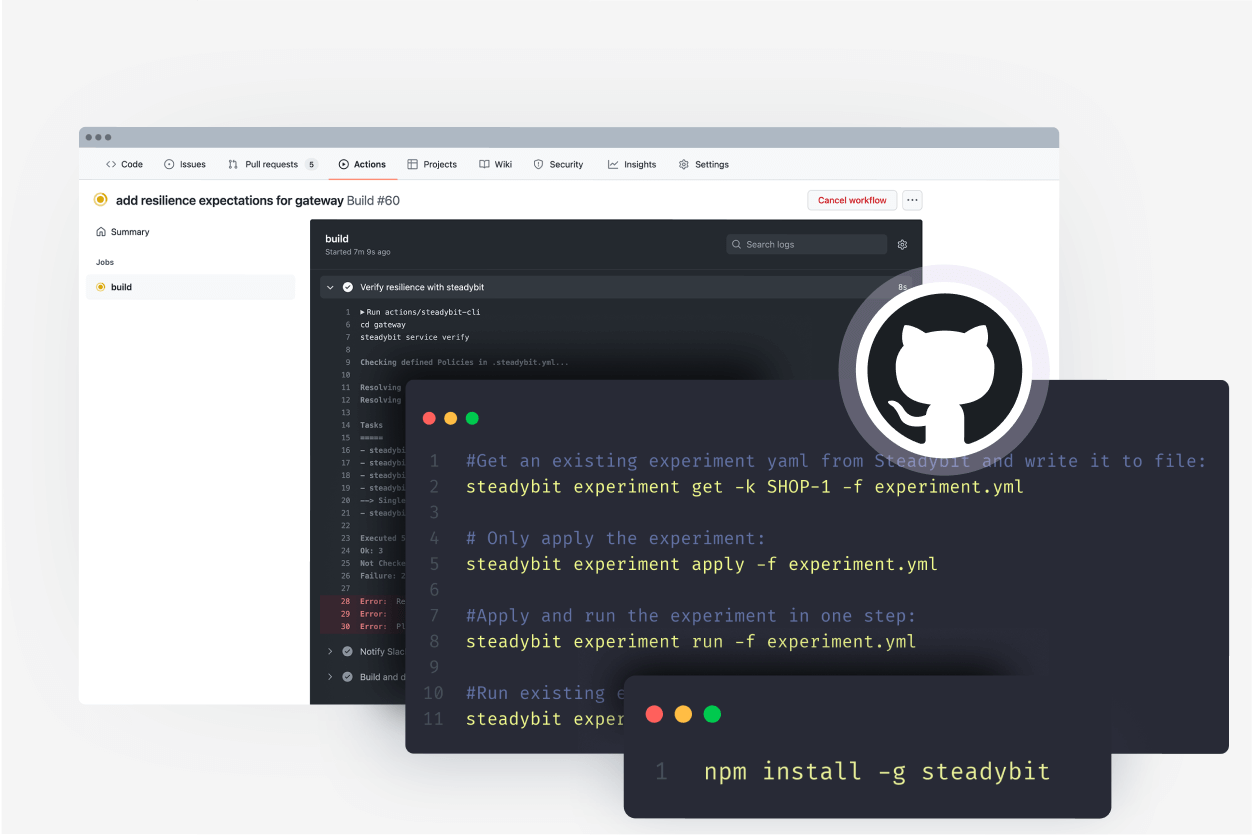
Schedule experiments or automate tests with the Steadybit API and CLI
You can run experiments manually, on a schedule, or with automation. Many teams will incorporate Steadybit experiments into their CI/CD workflow so they can continually verify experiments and ensure that new deployments meet a certain reliability standard.
With the Steadybit API and CLI, it’s easy to incorporate experiments into your development lifecycle to on your terms.
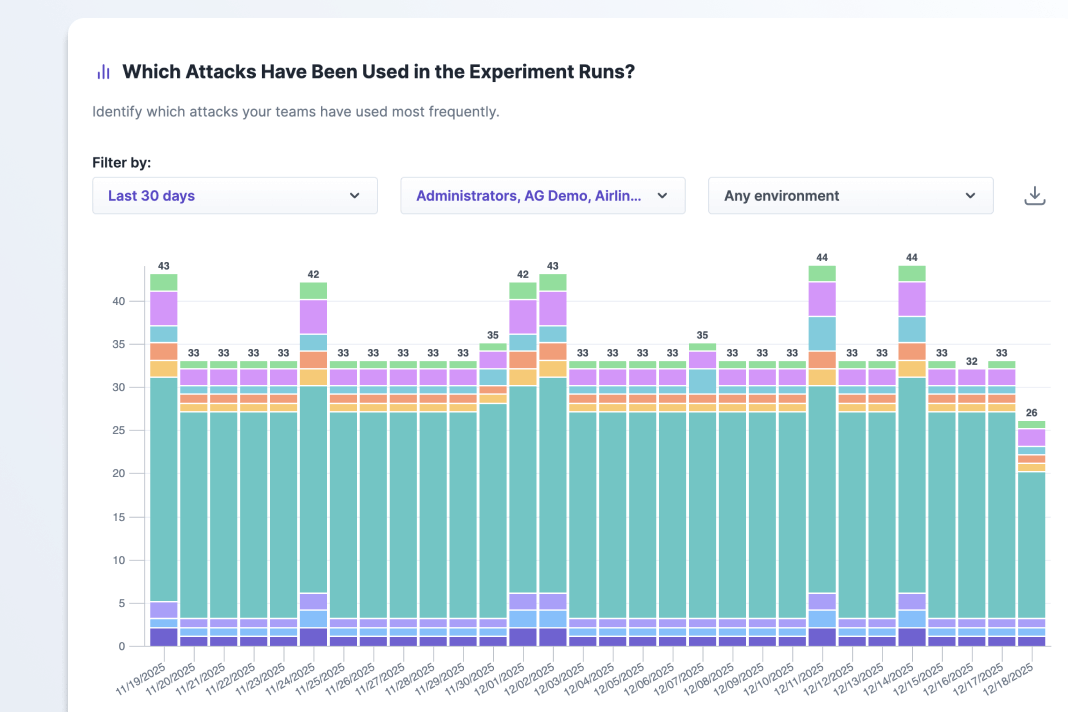
Track your progress with experiment and usage reports
As you run experiments across teams, you can track your progress with reports in Steadybit. See what types of attacks are being used most often, count experiment runs, and see how many issues you have found and fixed.
Browse Actions & Templates in the Reliability Hub
See what types of actions, targets, and templates are waiting for you and your team in our open source library.